
Meteo P4
Technical User Manual
Device Overview
Meteo P4 is a multifunction weather station based on the ESP32-P4. The device displays data from internal and external sensors, GNSS coordinates, an aviation-grade weather forecast, a clock synchronised via satellites and NTP, and also plays audio from an SD card and internet radio.
Technical Specifications
| Parameter | Value |
|---|---|
| Main processor | ESP32-P4, 2 cores, up to 360 MHz |
| Wi-Fi / Bluetooth | ESP32-C6 (separate chip, ESP-Hosted over SDIO) |
| Flash memory | 16 MB (DIO, 40 MHz) |
| PSRAM | 32 MB (HEX, 200 MHz) |
| Display | JC1060P470C, 1024×600 px, MIPI-DSI, 2 data lanes |
| Touchscreen | GT911 (I2C) |
| Audio codec | ES8311 (I2C + I2S) |
| SD card | SDMMC 4-bit, FAT32 with LFN |
| GNSS | UART, 38400/9600/57600/115200 baud (auto-detect) |
| RS485 (external sensors) | Modbus RTU, 9600 baud, half-duplex |
| Internal sensors | I2C bus: SHT41, BME280/BMP280, SCD41, SGP41, INA226 |
Connection Diagram
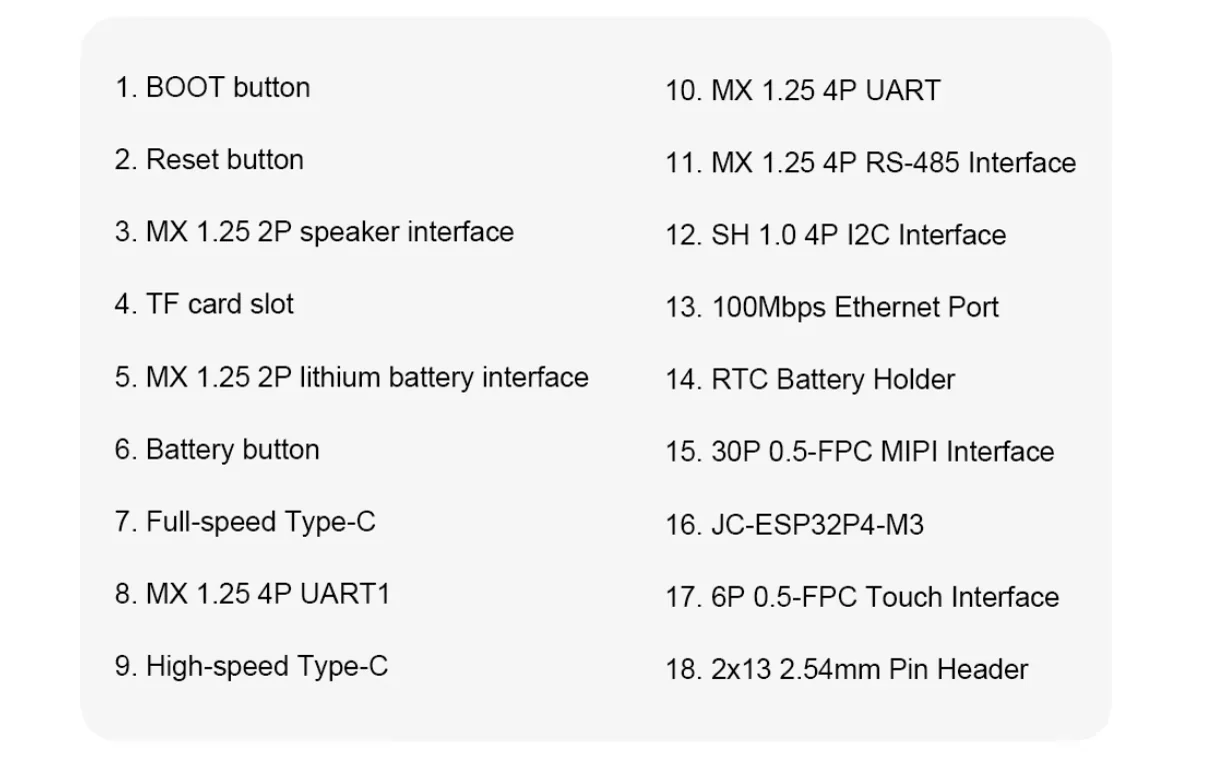
Connectors and components of the JC-ESP32P4-M3 board
The image below labels all connectors and control elements on the board (rear view).
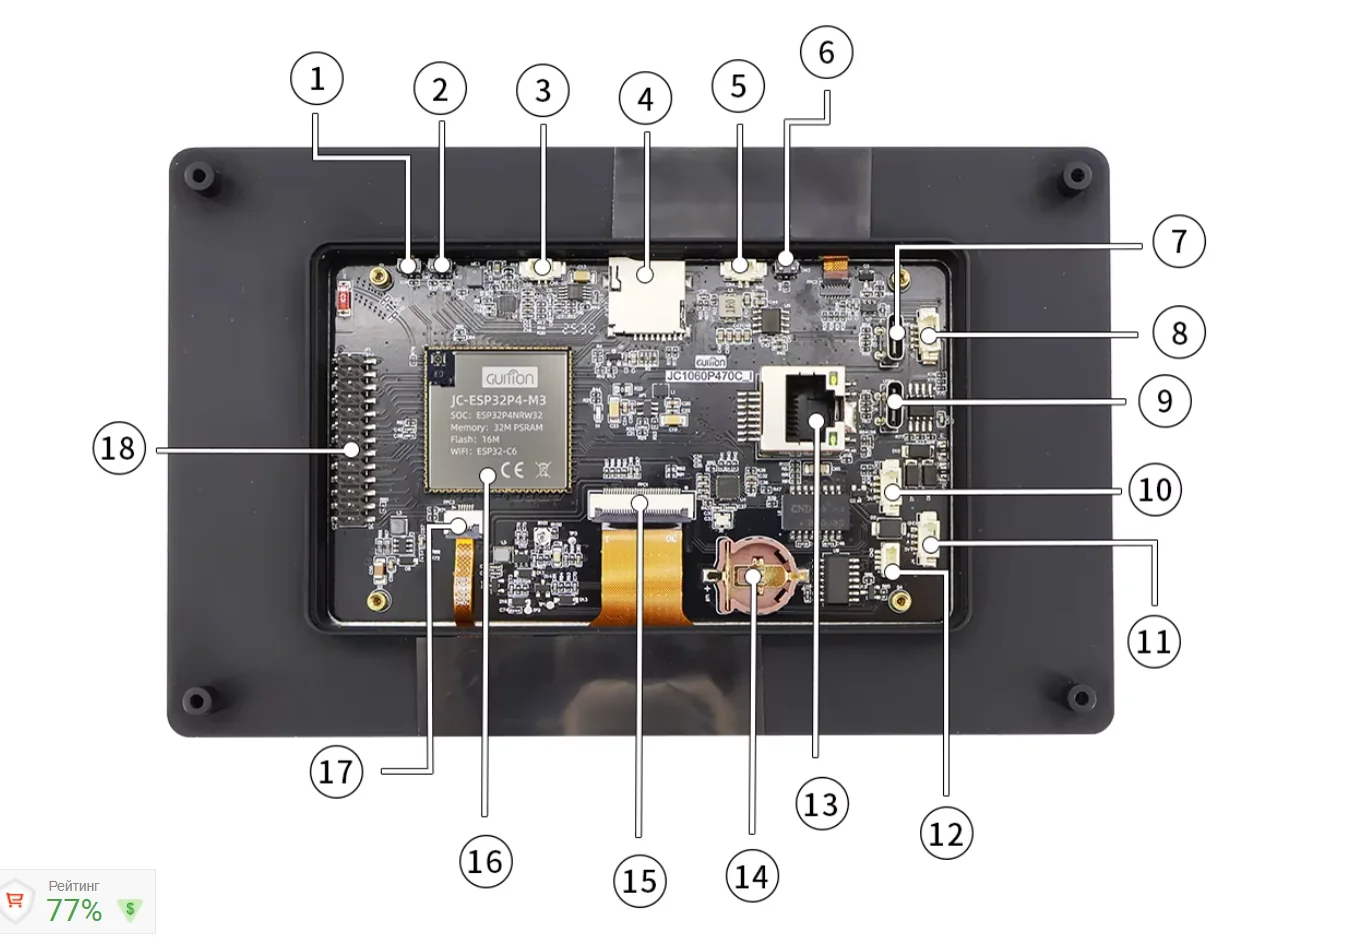
| # | Label | Purpose in Meteo P4 |
|---|---|---|
| 1 | BOOT button | Enter flashing mode (hold during reset) |
| 2 | Reset button | Reboot the device |
| 3 | MX 1.25 2P — Speaker | Speaker connection (ES8311 audio output) |
| 4 | TF card slot | microSD card (FAT32) — sensor logs, audio files |
| 5 | MX 1.25 2P — Li-Battery | Lithium battery (3.7 V, charge monitoring via INA226) |
| 6 | Battery button | Switch on power from the battery |
| 7 | Full-speed Type-C | USB Full-Speed — firmware flashing (esptool), Serial/JTAG debug |
| 8 | MX 1.25 4P — UART1 | GNSS module (TX/RX/3.3V/GND). GPIO37=TX, GPIO38=RX |
| 9 | High-speed Type-C | USB High-Speed (ESP32-P4 native USB) |
| 10 | MX 1.25 4P — UART | Auxiliary UART (spare / debug) |
| 11 | MX 1.25 4P — RS-485 | RS-485 bus (A+/B−/3.3V/GND) — outdoor SHT30 and anemometer |
| 12 | SH 1.0 4P — I2C | I2C bus (SDA/SCL/3.3V/GND) — SHT41, BME280, SCD41, SGP41, INA226 sensors |
| 13 | 100 Mbps Ethernet Port | Wired network (Ethernet 100Base-T) |
| 14 | RTC Battery Holder | CR2032 cell — real-time clock (RTC) |
| 15 | 30P 0.5-FPC MIPI | JC1060P470C display cable (1024×600, MIPI-DSI) — do not disconnect |
| 16 | JC-ESP32P4-M3 | Main module: ESP32-P4 + ESP32-C6 Wi-Fi, 32 MB PSRAM, 16 MB Flash |
| 17 | 6P 0.5-FPC Touch | GT911 touchscreen cable (I2C) — do not disconnect |
| 18 | 2×13 2.54 mm Pin Header | Expansion header (GPIO, power, SPI, etc.) |
Functional connection diagram
  ┌─────────────────────────────────────────────────────────────────┐
  │                    JC-ESP32P4-M3 BOARD                          │
  │                                                                 │
  │  #12 SH1.0 I2C ─── SDA/SCL ──── SHT41   (0x44/0x45) T°/RH%   │
  │                            ──── BME280  (0x76)      P/T°/RH%  │
  │                            ──── SCD41   (0x62)      CO₂        │
  │                            ──── SGP41   (0x59)      VOC/NOx    │
  │                            ──── INA226  (0x40)      V/I/P      │
  │                                                                 │
  │  #8  MX1.25 UART1 ─── TX/RX ──── GNSS module (38400 baud)     │
  │  #11 MX1.25 RS485 ─── A+/B− ──── MAX485 ──┬── SHT30  (0x01)  │
  │                                            └── Anemometer(0x03)│
  │  #3  MX1.25 2P    ─────────────── Speaker (ES8311 audio)       │
  │  #5  MX1.25 2P    ─────────────── Li-Ion battery 3.7 V         │
  │  #4  TF slot      ─────────────── SD card (FAT32)              │
  │  #13 Ethernet     ─────────────── 100 Mbps network             │
  │  #7  Type-C FS    ─────────────── PC (flashing / debug)        │
  │  #15 FPC 30P      ─────────────── 1024×600 MIPI-DSI display    │
  │  #17 FPC 6P       ─────────────── GT911 touchscreen            │
  │  #14 CR2032       ─────────────── RTC (clock when powered off) │
  └─────────────────────────────────────────────────────────────────┘
GPIO Assignments
| GPIO | Purpose | Interface |
|---|---|---|
7 | I2C SDA — all internal sensors, GT911 touch, ES8311 audio | I2C |
8 | I2C SCL | I2C |
9 | I2S DOUT (audio output to ES8311) | I2S |
10 | I2S WS (Word Select) | I2S |
11 | PA Enable — power amplifier enable | GPIO |
12 | I2S BCLK / SCLK (Bit Clock) | I2S |
13 | I2S MCLK (Master Clock to ES8311) | I2S |
20 | GNSS PPS — pulse-per-second (interrupt on both edges, GPIO_INTR_ANYEDGE) | GPIO INT |
23 | Display backlight (LEDC PWM) | LEDC |
26 | RS485 TX (MAX485 input D) | UART3 |
27 | RS485 RX (MAX485 output R) | UART3 |
37 | GNSS TX (data from the GNSS module) | UART1 |
38 | GNSS RX (commands to the GNSS module) | UART1 |
39 | SD D0 | SDMMC |
40 | SD D1 | SDMMC |
41 | SD D2 | SDMMC |
42 | SD D3 | SDMMC |
43 | SD CLK | SDMMC |
44 | SD CMD | SDMMC |
48 | I2S DIN (audio input from the microphone) | I2S |
53 | Battery voltage measurement (ADC2 CH4, 100 kΩ / 140 kΩ divider) | ADC |
54 | ESP32-C6 reset (Wi-Fi co-processor, active-high) | GPIO |
I2C Sensors (internal)
All internal sensors share a single I2C bus (GPIO7/8, 400 kHz). Polling every 2 seconds.
| Sensor | Address | Measures | Units |
|---|---|---|---|
| SHT41 | 0x44 or 0x45 (auto-detect) | Indoor air temperature, humidity | °C, % |
| BME280 (chip_id=0x60) | 0x76 | Atmospheric pressure, temperature, humidity | hPa, °C, % |
| BMP280 (chip_id=0x58) | 0x76 | Atmospheric pressure, temperature | hPa, °C |
| SCD41 | 0x62 | CO₂ concentration | ppm |
| SGP41 | 0x59 | VOC index, NOx index | 1–500 |
| INA226 | 0x40 | Bus voltage, current, power (battery) | V, mA, mW |
RS485 Sensors (external)
External sensors connect via the RS485 bus (Modbus RTU, 9600 baud, half-duplex). A MAX485 or equivalent is used. Bus polarity: A(+) / B(−).
  Meteo P4               MAX485                 RS485 bus
  ──────────             ──────────             ──────────────
  GPIO26 TX ──────────── D (input)
  GPIO27 RX ──────────── R (output)              A (+) ────── Outdoor SHT30 (addr 0x01)
                         A ─────────────────────             ────── Anemometer   (addr 0x03)
                         B ─────────────────────
                         DE/RE ── hardware control            B (−) ────── ...
| Device | Modbus address | Poll rate | Measures |
|---|---|---|---|
| SHT30 RS485 (outdoor) | 0x01 | 5 seconds | Outdoor temperature and humidity |
| Anemometer | 0x03 | 1 second | Wind speed (m/s), EMA filter α=0.35 |
RS485 connector pinout (#11, MX 1.25 4P)
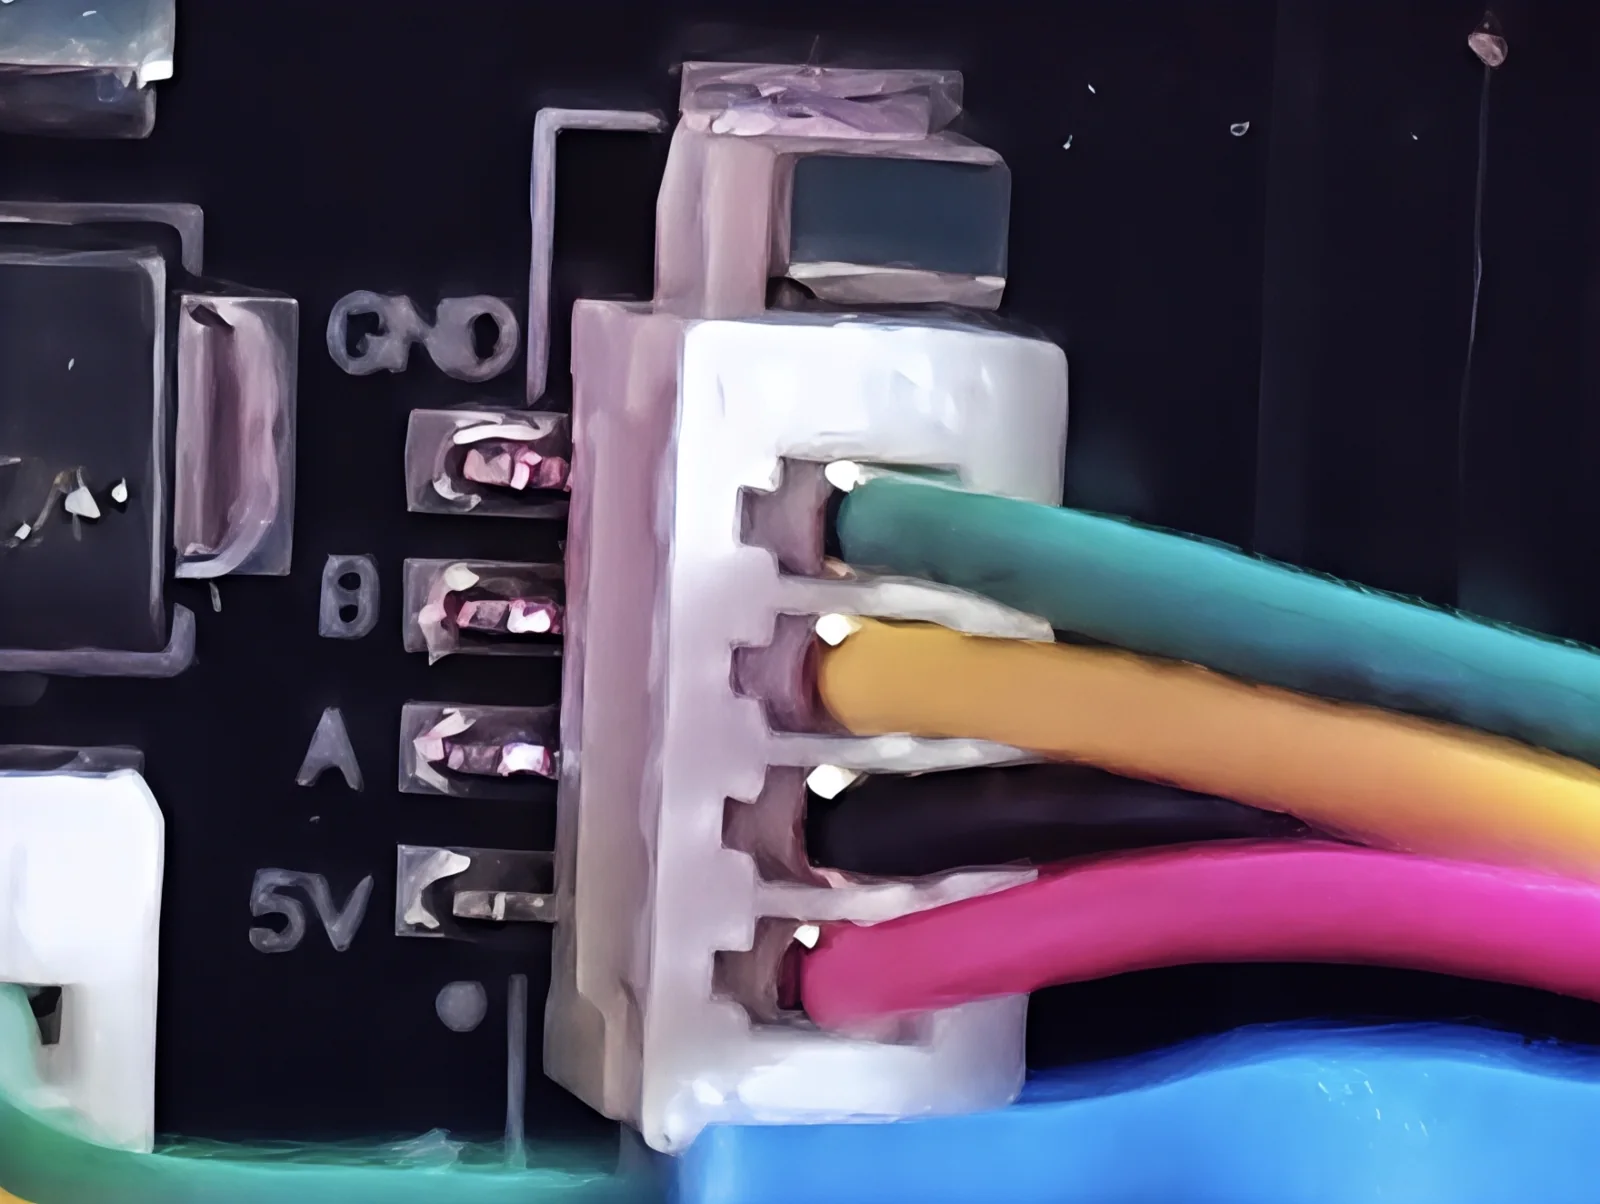
| Pin on the board | Wire colour | Purpose |
|---|---|---|
| GND | ■ Green | Ground (common) |
| B | ■ Yellow | RS485 B (−) |
| A | ■ Black | RS485 A (+) |
| 5V | ■ Pink | Sensor power 5 V |
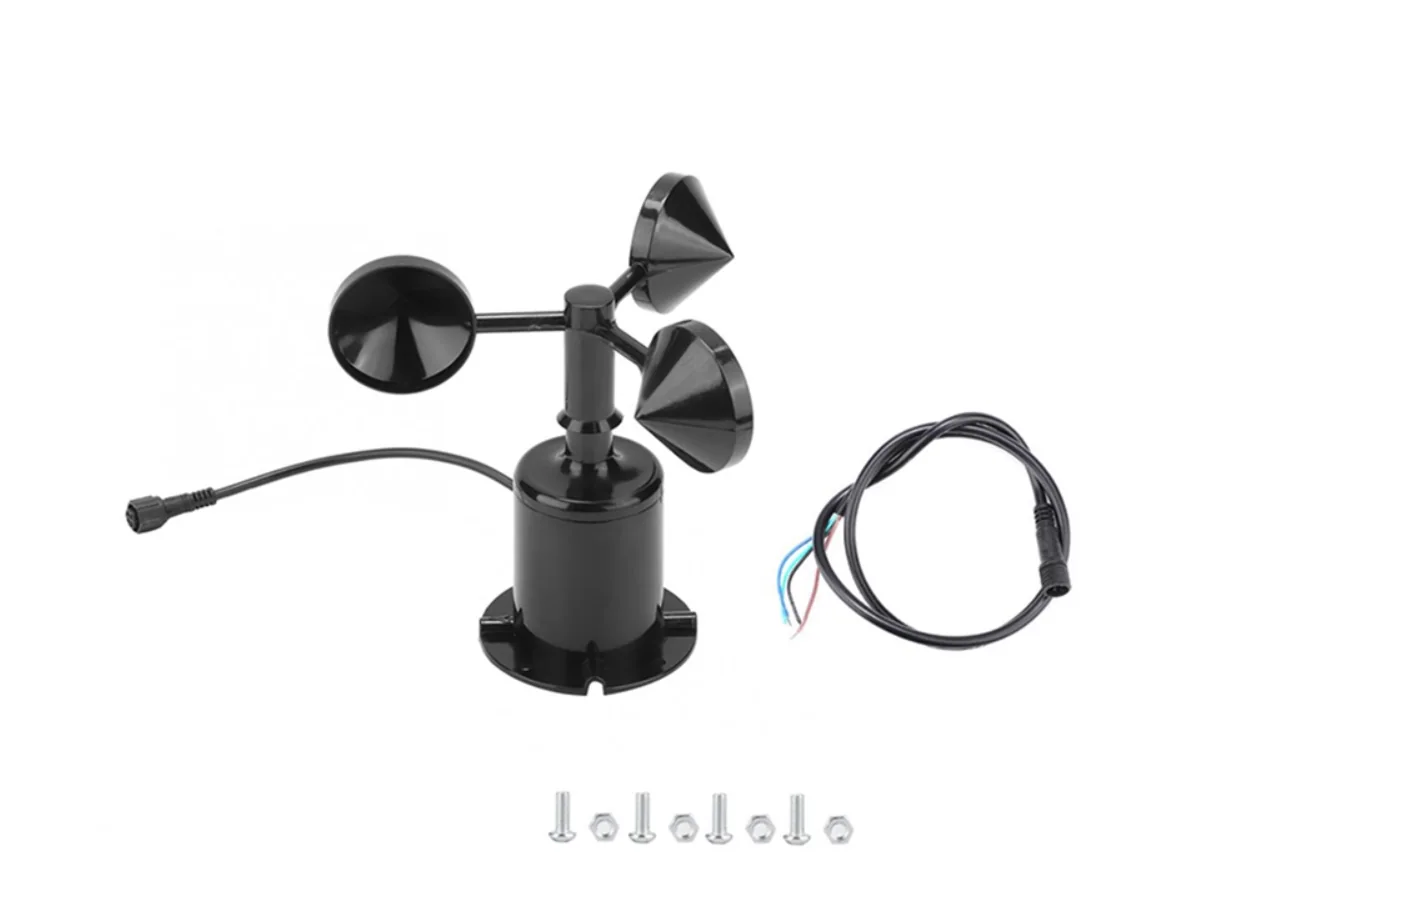
Outdoor T°/RH% SHT30 sensor (RS485, Modbus addr 0x01)
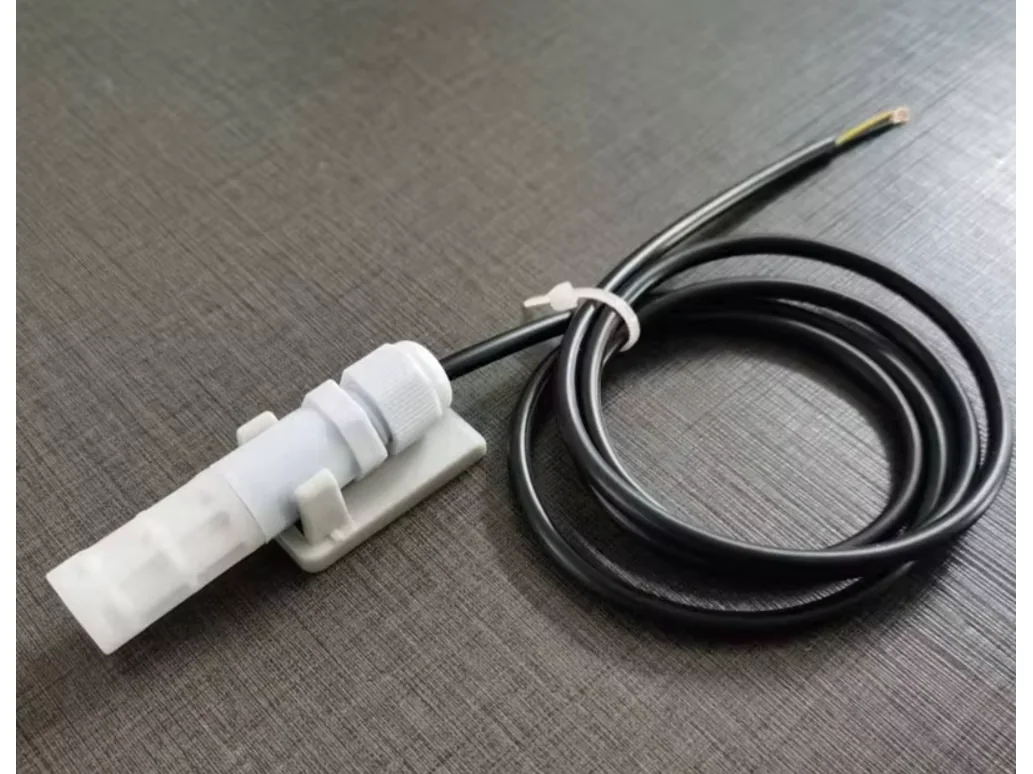
3-cup anemometer (RS485, Modbus addr 0x03)
Power and Battery
Battery measurement
The battery voltage is measured through a resistive divider on GPIO53 (ADC2, channel 4). The data is shown in the Battery tile on the Settings screen.
| INA226 parameter | Value |
|---|---|
| Shunt resistor | 0.100 Ω |
| Current LSB | 0.1 mA |
| End-of-charge threshold | Current ≤ 20 mA AND voltage ≥ 4.10 V |
Screen Navigation
Screens are switched by swipes (horizontal gestures) and taps on control elements. Transition animation: 220 ms.
Transition map (swipes)
| Current screen | Swipe left → | Swipe right ← |
|---|---|---|
| Main | Details (Sensors) | GNSS |
| Details (Sensors) | Player | Main |
| GNSS | Main | — |
| Charts | — | Details (Sensors) |
| Player | — | Details (Sensors) |
| Local Forecast | — | Settings |
| Hourly Forecast (5 days) | — | Main |
| Scenarios / Alarm | — | Main |
| Wi-Fi (networks) | — | Main |
| Wi-Fi (password entry) | — | Wi-Fi (networks) |
| Settings | — | Main |
| Service | — | Settings |
| Diagnostics | — | Settings |
| About | — | Settings |
| LED Indicators | — | Settings |
| Server (MQTT) | — | Settings |
Tap transitions
- Icon ⚙ (gear) in the Main header → Settings
- Wi-Fi chip in the Main header → Wi-Fi screen
- "SCENARIO" chip in the Main header → Scenarios
- Button ▶ in the "5-DAY FORECAST" block on the Main screen → Hourly Forecast (5 days)
- A forecast day row → that day in the Hourly Forecast
- Buttons "AIR" / "HUM." on the Sensors screen → Charts (corresponding page)
- Control Center tiles → linked sub-screens (see Settings section)
Main Screen
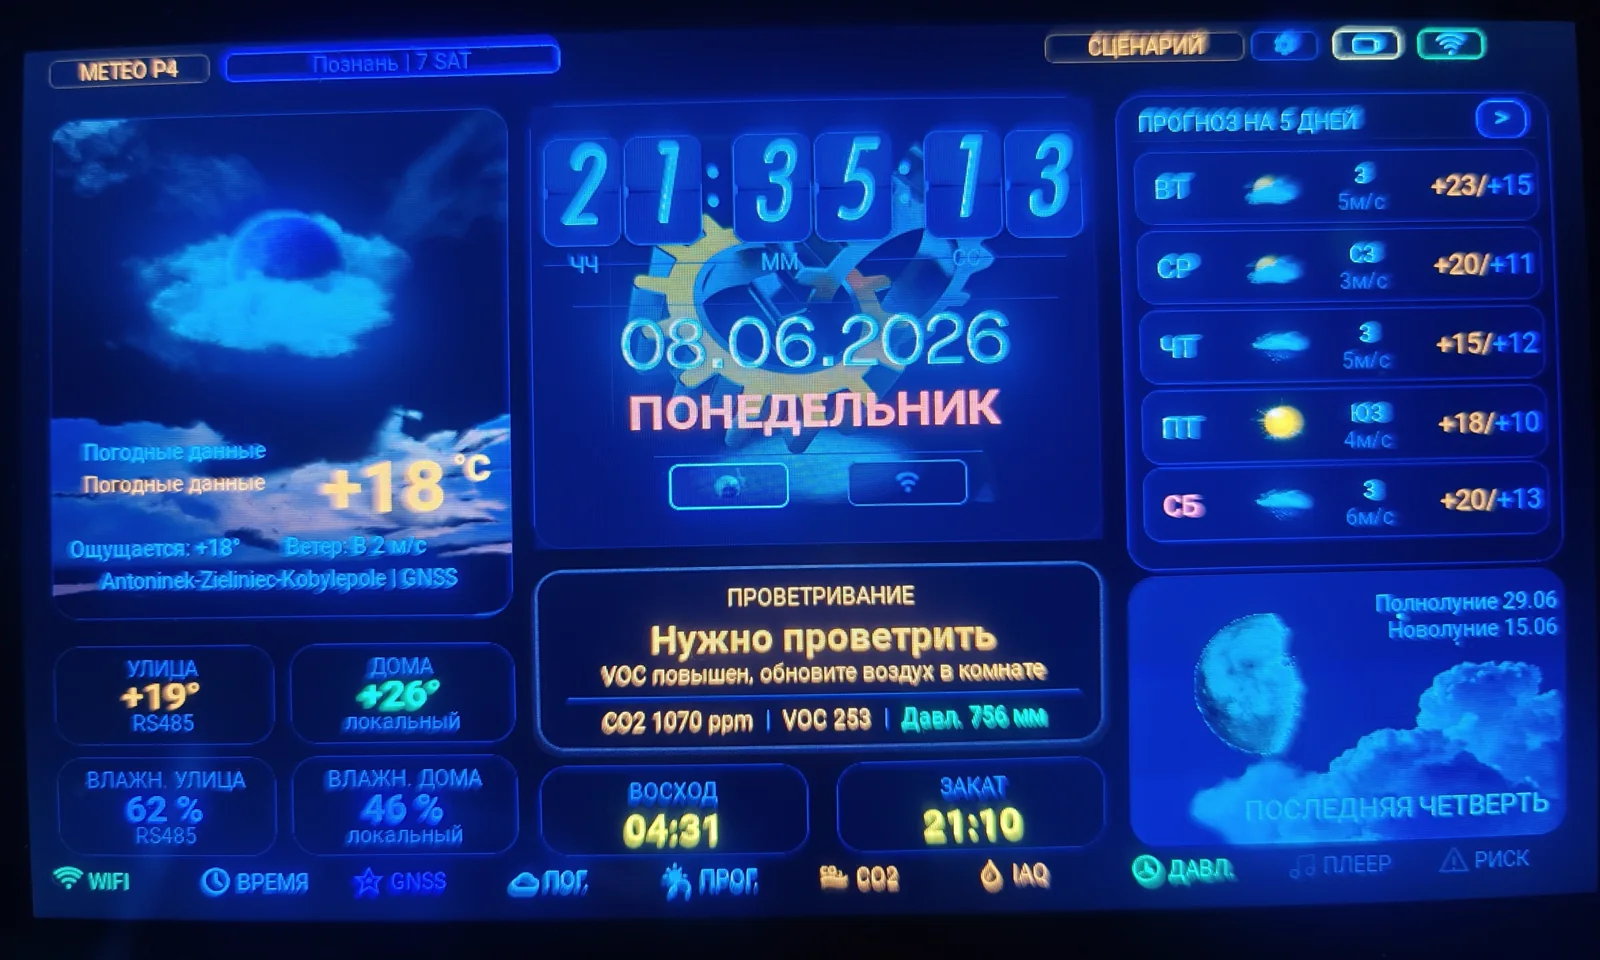
Top bar (header)
- METEO P4 — device name (orange chip, left edge)
- City + satellites chip:
GNSS Nor city name from geocoding - SCENARIO chip — clickable, opens the Scenarios screen
- ⚙ chip (LV_SYMBOL_SETTINGS) — opens Settings
- Battery chip (level icon) — status only, no link
- Wi-Fi chip (icon) — opens the Wi-Fi screen
- Bottom indicator row (10 items):
WIFI·TIME·GNSS·WEATH.·FORE.·CO2·IAQ·PRESS.·PLAYER·RISK
Left column — weather and sensors
- Weather icon + "Weather data"
- Outdoor temperature (large, °C)
- Feels like + wind speed
- City + source (GNSS)
- OUTDOOR T° (RS485) / INDOOR T° (local)
- HUM. OUTDOOR % (RS485) / HUM. INDOOR % (local)
Centre — clock and ventilation
- Time HH:MM:SS (split-flap style, large digits)
- Date: DD.MM.YYYY
- Day of the week
- Sync icons: 🏠 GNSS / 📶 NTP
- VENTILATION card: status + CO₂/VOC/Pressure metrics
- SUNRISE / SUNSET (time)
Right column — forecast and moon
- Heading 5-DAY FORECAST + button ▶
- 5 rows: day of week + icon + wind direction and speed + MAX/MIN °C
- Moon phase (icon + phase name)
- Dates: Full Moon / New Moon
5-day forecast
The bottom of the screen contains 5 forecast rows. Each row shows:
- Day of the week
- Weather icon
- Day / night temperature
- Wind direction and speed
Tapping a row opens the Multi-day forecast with details.
The "Aviation forecast" button opens the aviation screen.
Pressure and trend
Pressure is shown in mmHg. Trends:
| Text | Threshold |
|---|---|
| Rising fast | +3 hPa per 3 hours |
| Rising | +0.5 hPa per 3 hours |
| Stable | within ±0.5 hPa |
| Falling | −0.5 hPa per 3 hours |
| Falling fast | −3 hPa per 3 hours |
Ventilation card
Based on CO₂, VOC and humidity, the device issues a ventilation recommendation for the room.
Moon phase
Shows the current phase, the date of the next full moon and new moon, as well as sunrise and sunset.
Sensor Details
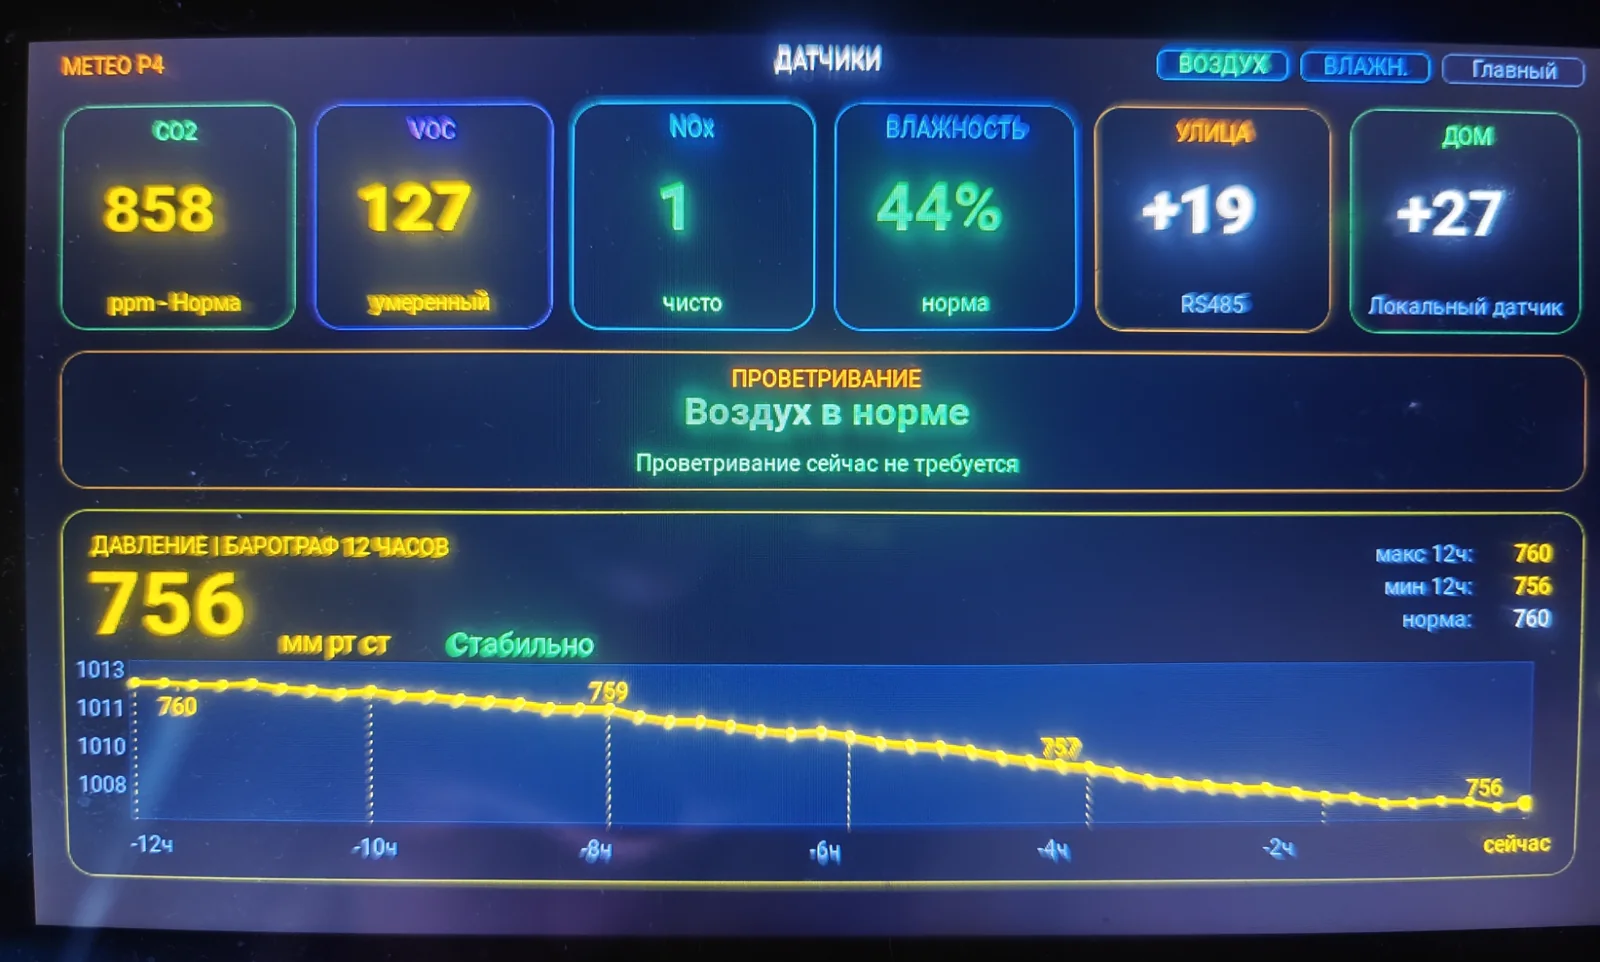
Access: swipe left from the Main screen. Title: SENSORS. Buttons in the upper-right corner: AIR / HUM. / Main.
Top row — sensor tiles
| Tile | Source | Unit | Quality assessment |
|---|---|---|---|
| CO₂ | SCD41 | ppm | Normal / Elevated / High / Critical |
| VOC | SGP41 | index 1–500 | normal / moderate / high |
| NOx | SGP41 | index 1–500 | clean / elevated |
| HUMIDITY | SHT41 / BME280 | % | normal / dry / humid |
| OUTDOOR | RS485 SHT30 | °C | source: RS485 |
| INDOOR | SHT41 / BME280 | °C | source: Local sensor |
VENTILATION card
Composite recommendation based on CO₂, VOC, humidity and outdoor temperature — hysteresis-based, 6 levels (in priority order):
| Level | Title | Trigger | Colour |
|---|---|---|---|
| 1 | Ventilate now | CO₂ critical (≥ 1400 ppm with hysteresis down to 1350) | Pink |
| 2 | Needs ventilation | VOC index high | Orange |
| 3 | Ventilation recommended | CO₂ warn (≥ 1000 ppm) | Orange |
| 4 | Reduce humidity | Indoor humidity above threshold | Orange / Cyan |
| 5 | Not needed now | Indoor air is dry | Cyan |
| 6 | Air is normal | All parameters within range | Green |
Below the title — a hint with a concrete recommendation on ventilation duration (taking outdoor temperature into account: short in frost/heat, longer in normal conditions).
NOISE tile (below the main row)
A narrow horizontal strip titled NOISE with a scale (0–100) and a dB-index value. Data from the ES8311 microphone via the noise_meter component.
Barograph (PRESSURE | 12-HOUR BAROGRAPH)
Large current pressure value in mmHg + text trend ("pressure tendency" / "Stable" / "Rising" / "Falling" etc., see trend table on the Main screen).
Chart: 12-hour points with time markers (−12h / −10h / −8h / −6h / −4h / −2h / now). On the right: max 12h:, min 12h:, norm: (default value "750").
Navigation buttons
- AIR → Charts screen, "Air" page (CO₂ / VOC / Wind)
- HUM. → Charts screen, "Humidity" page
- Main → Main screen
GNSS Screen
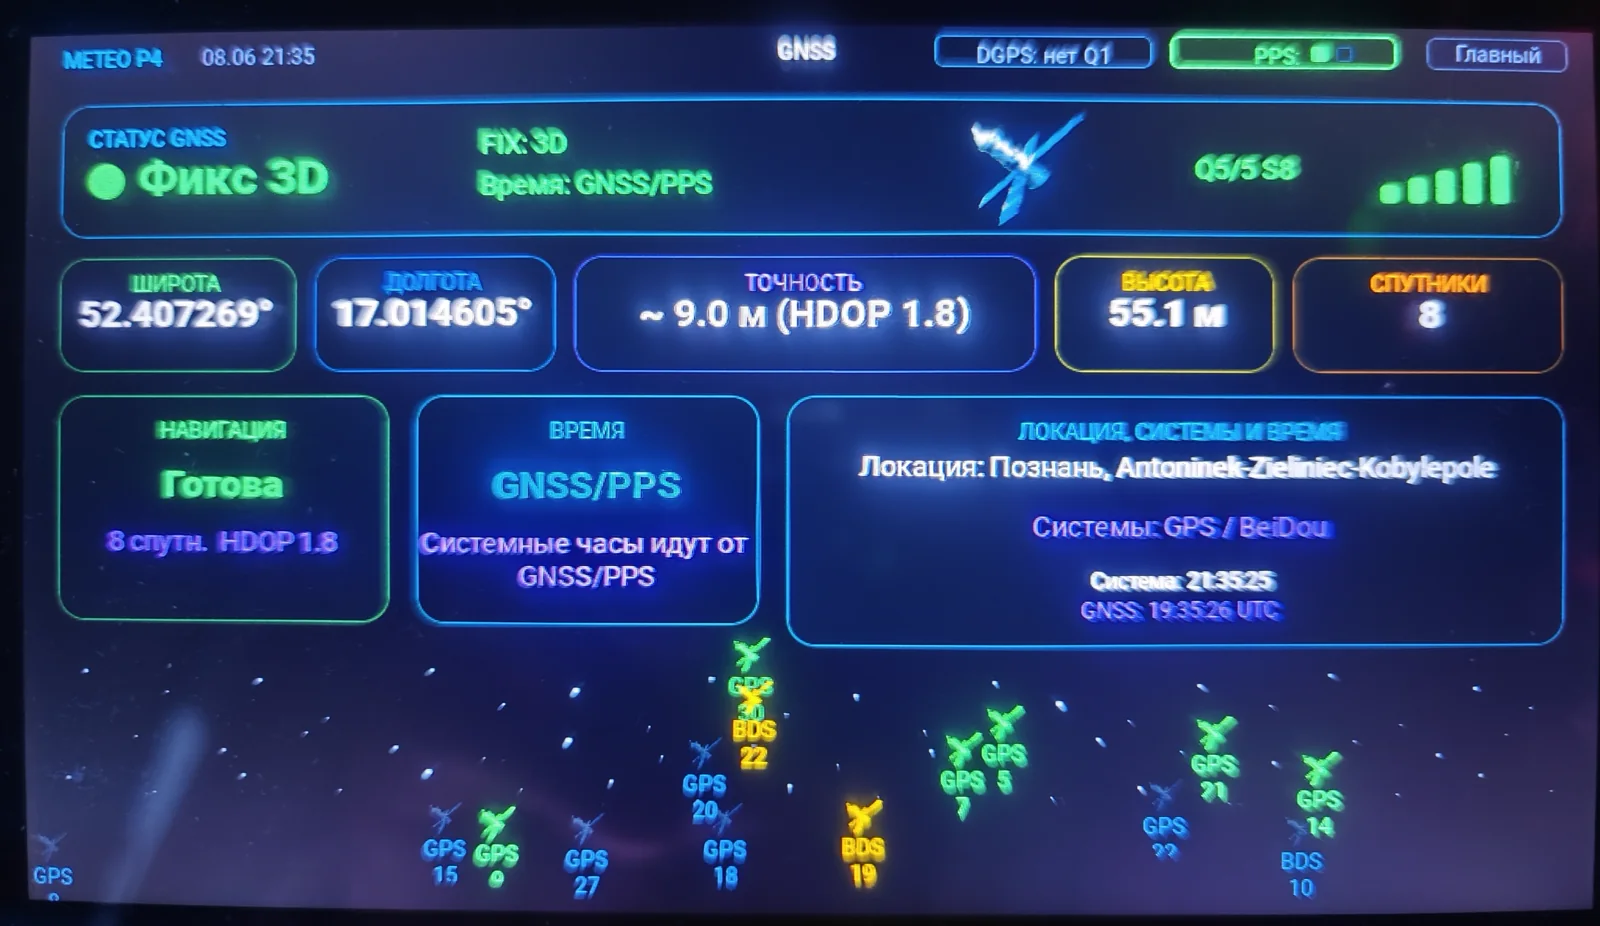
Access: swipe right from the Main screen. Screen header: METEO P4 chip (cyan), then a date/time segment --.-- --:--, the title GNSS in the centre, the DGPS: no/ready chip, the PPS: chip with two LED segments (blink each second), and the "Main" button.
Top bar — GNSS STATUS
- Coloured fix dot (red → yellow → green) + large label "No fix" / "FIX 2D" / "FIX 3D" / "FIX DGPS"
FIX: --— numeric fix type (NMEA)Time: waiting / GNSS/PPS / NTP / none- Satellite icon (gnss_sync_sat_icon) + 5-segment signal-quality bar
Q --— reception quality
Coordinate tiles
| Tile | Content |
|---|---|
| LATITUDE | XX.XXXXXX° (decimal degrees) |
| LONGITUDE | XX.XXXXXX° |
| ACCURACY | ~ X.X m (HDOP X.X) |
| ALTITUDE | XX.X m (above sea level) |
| SATELLITES | N (number in fix) |
Lower three blocks
NAVIGATION
Ready / Not ready
N sats HDOP X.X
TIME
Source: GNSS/PPS / NTP / none
"System clock comes from GNSS/PPS"
LOCATION, SYSTEMS AND TIME
Location: city (from geocoding)
Systems: GPS / BeiDou / GLONASS / Galileo
System time + GNSS UTC
Lower part — Skyview (orbital animation)
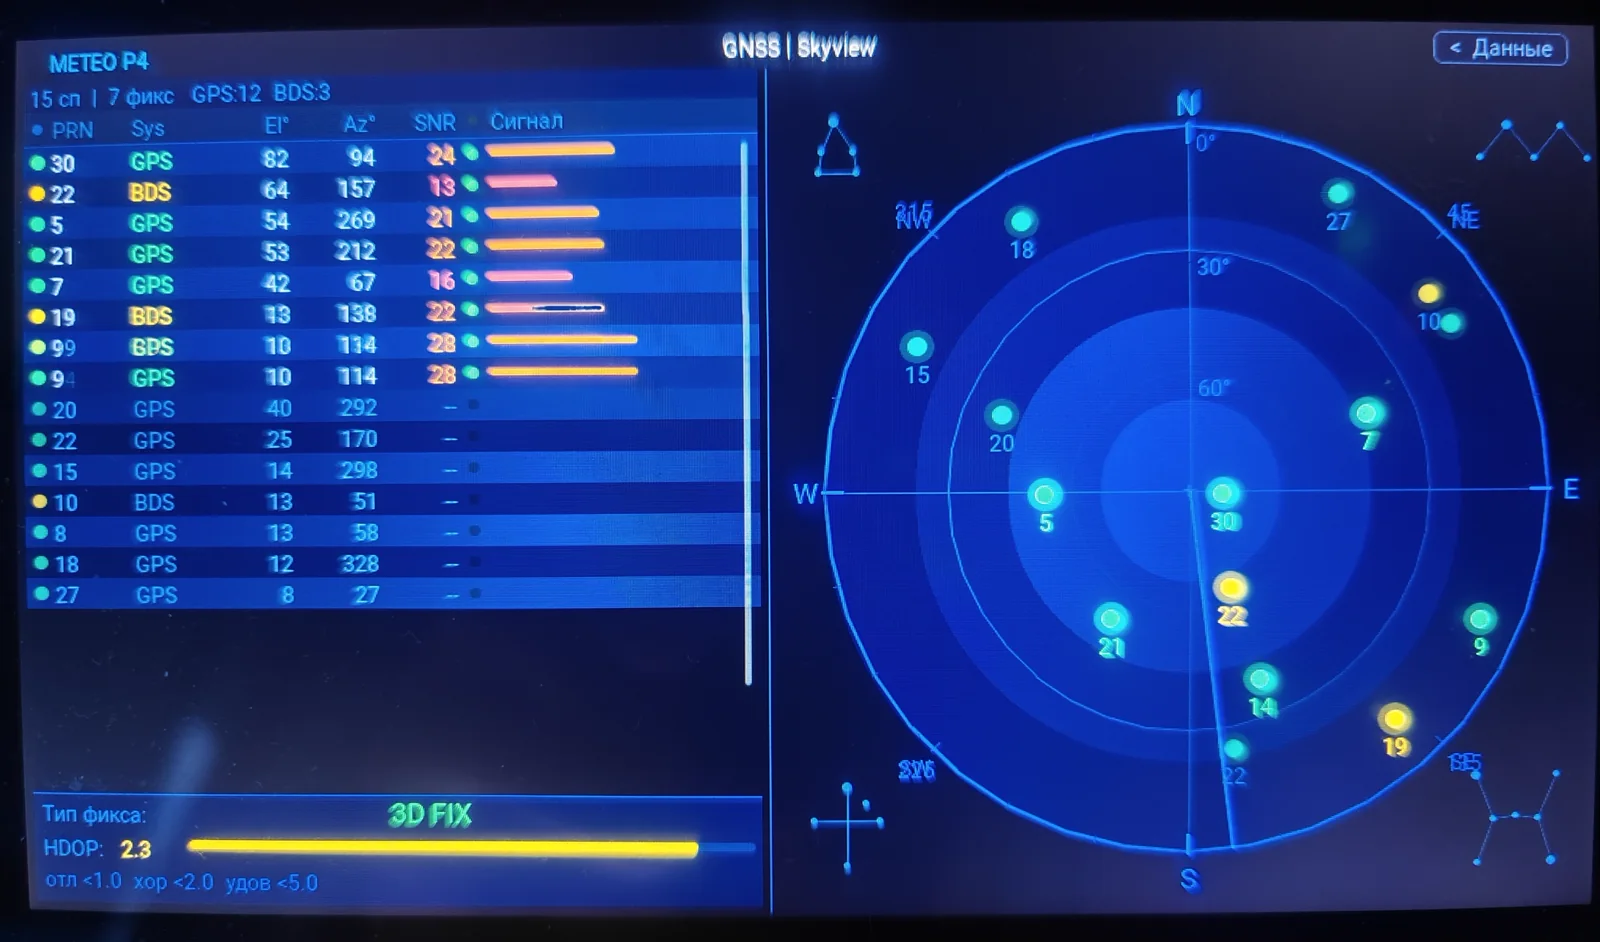
Area contents:
- Decorative star field (54 static stars of varying brightness)
- Two animated "shooting stars" (meteors) with 38 px tails, looping with 9–11 s pauses
- Real satellite icons (
gnss_skyview_build / gnss_skyview_update), coloured by system
System colours (per gnss_skyview_ui code)
| Colour | System |
|---|---|
| ■ Blue | GPS (USA) |
| ■ Red | GLONASS (Russia) |
| ■ Green | Galileo (EU) |
| ■ Orange | BeiDou (China) |
| ■ Cyan | SBAS (differential correction) |
HDOP scale (shown on the GNSS screen)
| HDOP | Assessment | Colour |
|---|---|---|
| < 1.0 | Excellent | Green |
| < 2.0 | Good | Light blue |
| < 5.0 | Acceptable | Yellow |
| ≥ 5.0 | Poor | Red |
Local Forecast
Access: the "Local Forecast" tile in the Control Center (Settings). Actual screen title: LOCAL FORECAST.
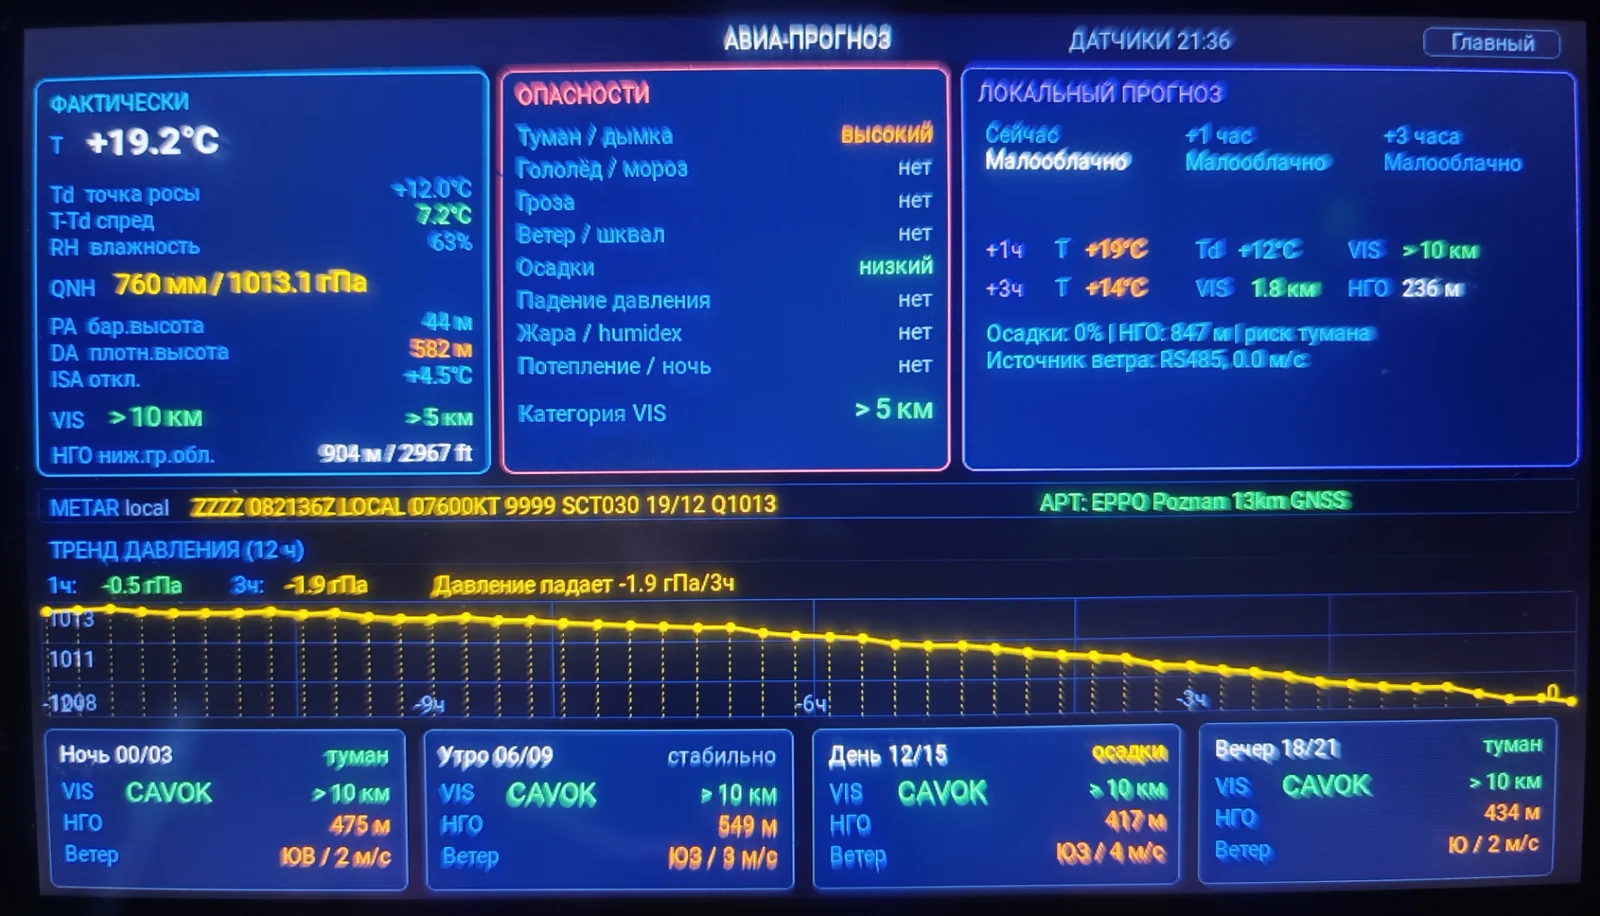
SENSORS --:--. Return — swipe right (to Settings).
Card A — CURRENT / ESTIMATE
| UI label | Description |
|---|---|
| T | Air temperature (°C) |
| Td dew point | Dew point (°C) — temperature at which condensation begins |
| T-Td spread | T − Td difference: the smaller it is, the higher the chance of fog/clouds |
| RH | Relative humidity (%) |
| P0~ | Sea-level pressure (mmHg) — QNH equivalent |
| Baro alt~ | Barometric altitude (m) — PA equivalent |
| Density alt~ | Density altitude (m) — DA equivalent |
| T − standard~ | Deviation from the ISA standard atmosphere (°C) |
| Visibility~ | Horizontal visibility (m or km) |
| Cloud base~ | Cloud base height (m AGL) — ceiling equivalent |
Card B — HAZARDS
Each hazard type is colour-coded:
| Level | Colour | Meaning |
|---|---|---|
| NONE | Grey | No hazard |
| LOW | Green | Low risk |
| MODERATE | Yellow | Moderate risk |
| HIGH | Orange | High risk |
| SEVERE | Red | Hazardous conditions |
The phenomena evaluated in code (8 rows): Fog / haze, Ice / frost, Thunderstorm, Wind / squall, Precipitation, Pressure drop, Heat / humidex, Warming / night. Below them — a separate row Visibility range~.
Card C — LOCAL FORECAST
Three horizons: Now / +1 h / +3 h. Compact rows with numeric values appear below the columns: for +1h — T / Td / Vis., for +3h — T / Vis. / Clouds.
Card D — MODEL
A narrow strip at the bottom: MODEL label, a summary text from the model (e.g. HH:MM | waiting for data) and on the right a Location: local marker or a geographic reference.
Card E — PRESSURE TREND (12 h)
Heading PRESSURE TREND (12 h). Numeric deltas: 1h: -- hPa, 3h: -- hPa. Text interpretation Waiting… / trend. 12-hour barograph with a sample roughly every 15 minutes.
Hourly Forecast (5 days)
Access: tap the ▶ button in the "5-DAY FORECAST" block on the Main screen, or tap a day row. Actual screen title: HOURLY FORECAST. The "Main" button in the upper-right corner returns.
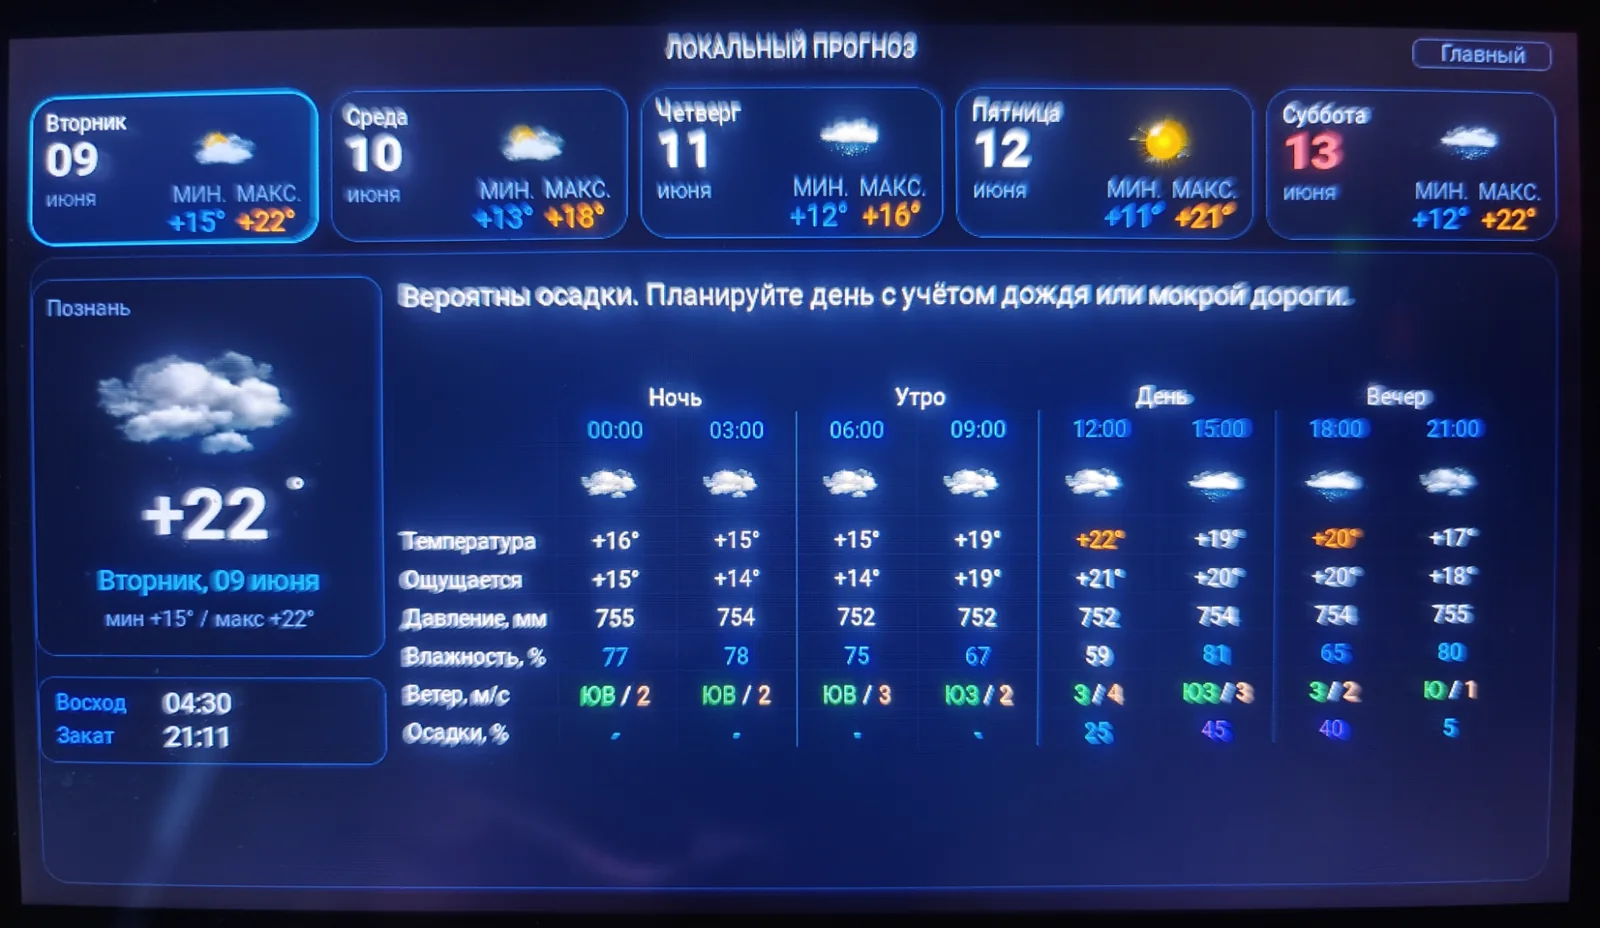
Top row — day selector
5 tiles with weekdays and dates. The active day is highlighted with a blue border. Each tile: weekday, day, month, MIN/MAX temperature.
Lower panel — details of the selected day
Left block — day summary
- City (from GNSS geoposition)
- Weather icon
- Maximum temperature (large)
- Weekday and date
- MIN / MAX temperature
- Sunrise and Sunset
- Short day description (text)
Right block — hourly table
8 columns: 00:00 / 03:00 / 06:00 / 09:00 / 12:00 / 15:00 / 18:00 / 21:00
Table rows:
- Weather icons by hour
- Temperature (°C)
- Feels like (°C)
- Pressure (mmHg)
- Humidity (%)
- Wind (direction / m/s)
- Precipitation (%)
Charts
Access: the "Air charts" or "Humidity charts" buttons on the Details screen.
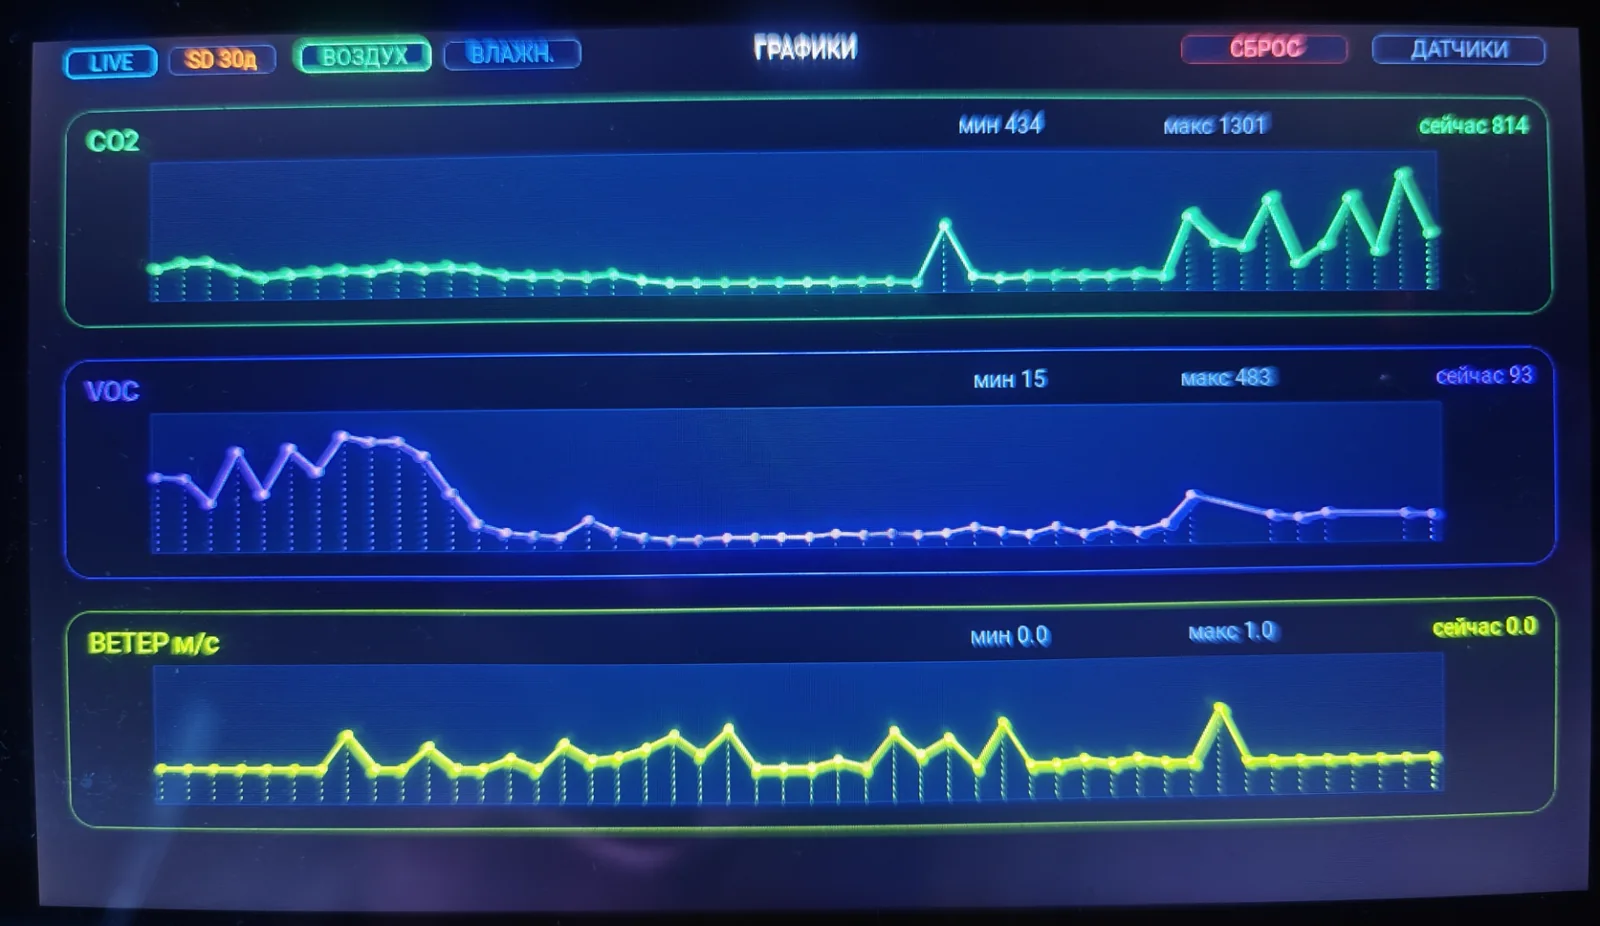
Filter buttons (top panel)
- LIVE (cyan) — real-time data
- SD 30d (orange) — 30-day history from the SD card (
history_loggerarchive) - AIR (green) — CO₂, VOC, WIND m/s page
- HUM. (blue) — humidity page
- RESET (red) — clears accumulated data (opens a "Reset logs" confirmation dialog with YES / CANCEL buttons)
- SENSORS (back) — return to the Sensors screen
Charts (AIR tab)
| Chart | Colour | Shows | Above chart |
|---|---|---|---|
| CO₂ | Green | CO₂ concentration (ppm) | min / max / now |
| VOC | Purple | VOC index (1–500) | min / max / now |
| WIND m/s | Yellow | Wind speed (RS485 anemometer) | min / max / now |
Each chart: a line with points at samples, vertical dashed shadows, Y-axis auto-scaling. Data is stored in LP-SRAM (survives reboot), with backups in SPIFFS and on the SD card.
Media Player
Access: swipe left from the Sensors screen, or Settings → "Media" tile.
Header title: METEO P4 PLAYER (with double space). The BACK button is on the right. Two source modes — switched using the buttons in the top part of the left panel.
Left panel — status
- Source buttons: SD CARD / WI-FI (active one highlighted)
- "Art box" with a source icon (SD card or radio) and animated particle dots
STATUSheading + coloured dot + value:Stopped/Playing/Paused/Connecting/Loading/Error/Backend offline- Wi-Fi line:
Wi-Fi offlineorSSID/IP QUEUEheading + large-- / --(current track / total)- Track/folder subtitle (DOT truncation)
Sleep timer (SLEEP TIMER)
- Buttons: 15 MIN, 30 MIN, 45 MIN, 1 HOUR, X (cancel; ASCII Latin
X, not a Unicode cross) - "Sleep: off" line → "Sleep: MM:SS" (minutes:seconds countdown)
- Repeat: off / track / folder
WI-FI RADIO mode
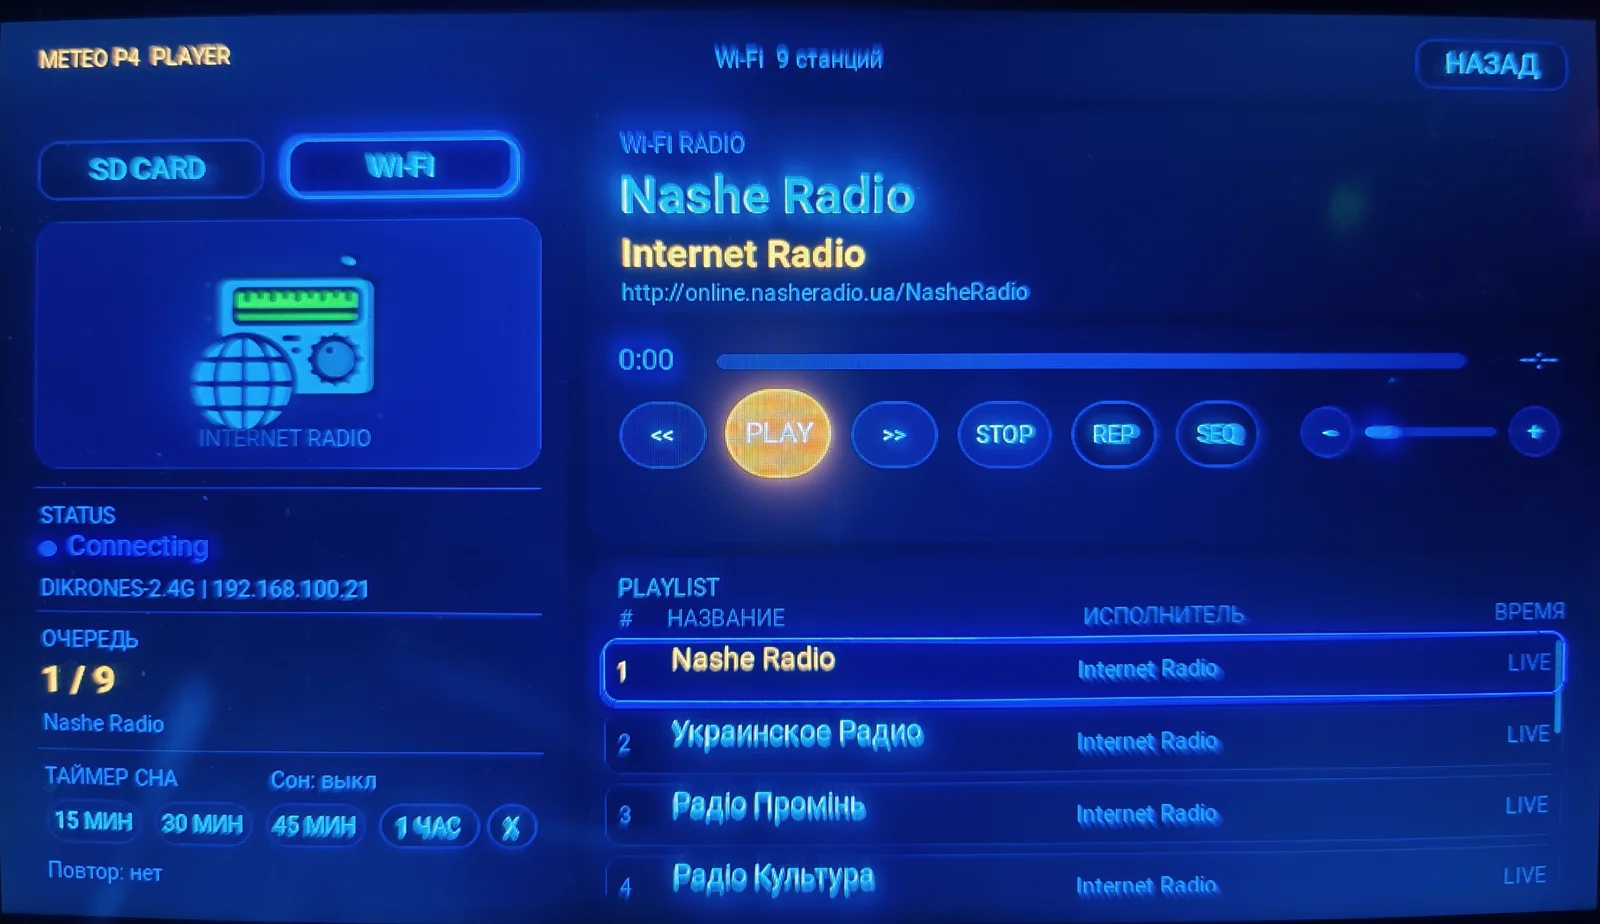
The header shows the number of stations: "Wi-Fi N stations". Right panel:
- Type: WI-FI RADIO
- Station name (large) and genre (Internet Radio)
- Stream URL
- Buffering progress bar
SD CARD mode
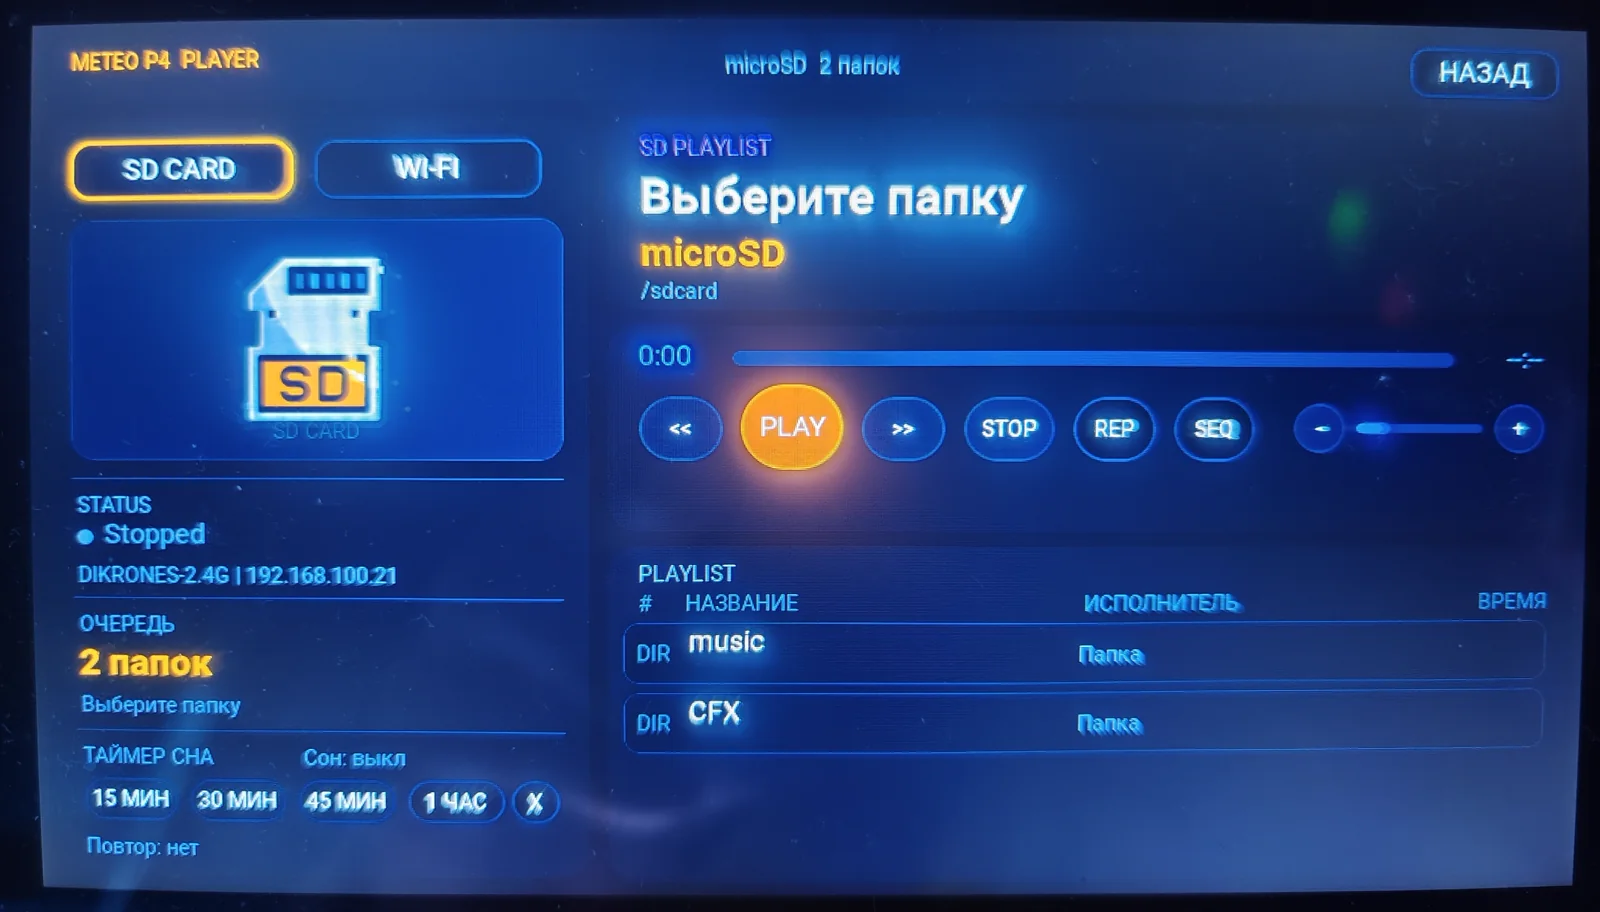
In the central header label (dynamic meta) — a folder counter. The right panel contains the Meta card:
- Coloured source-type label: SD PLAYLIST
- Large track title (with DOT truncation), artist subtitle, album label
- Playback progress bar (left — current time
0:00, right — total0:00) with an animated highlight - Playlist card with column headings:
#/TITLE/ARTIST/TIMEand a scrollable track list
Control buttons (common to both modes)
| Button | Action |
|---|---|
| << | Previous track / station |
| PLAY | Play / pause (large round orange button) |
| >> | Next track / station |
| STOP | Stop playback |
| REP | Repeat (off / track / folder) |
| MIX | Order mode (sequential / random) |
| - / + | Volume (ASCII minus/plus) — slider from 0 to 100 |
| BACK | Return to the previous screen |
Scenarios / Alarm
Access: the SCENARIO chip in the Main screen header. Header title: METEO P4 | SCENARIOS, in the centre — the current scenario name, on the right — clock --:-- and the BACK button.
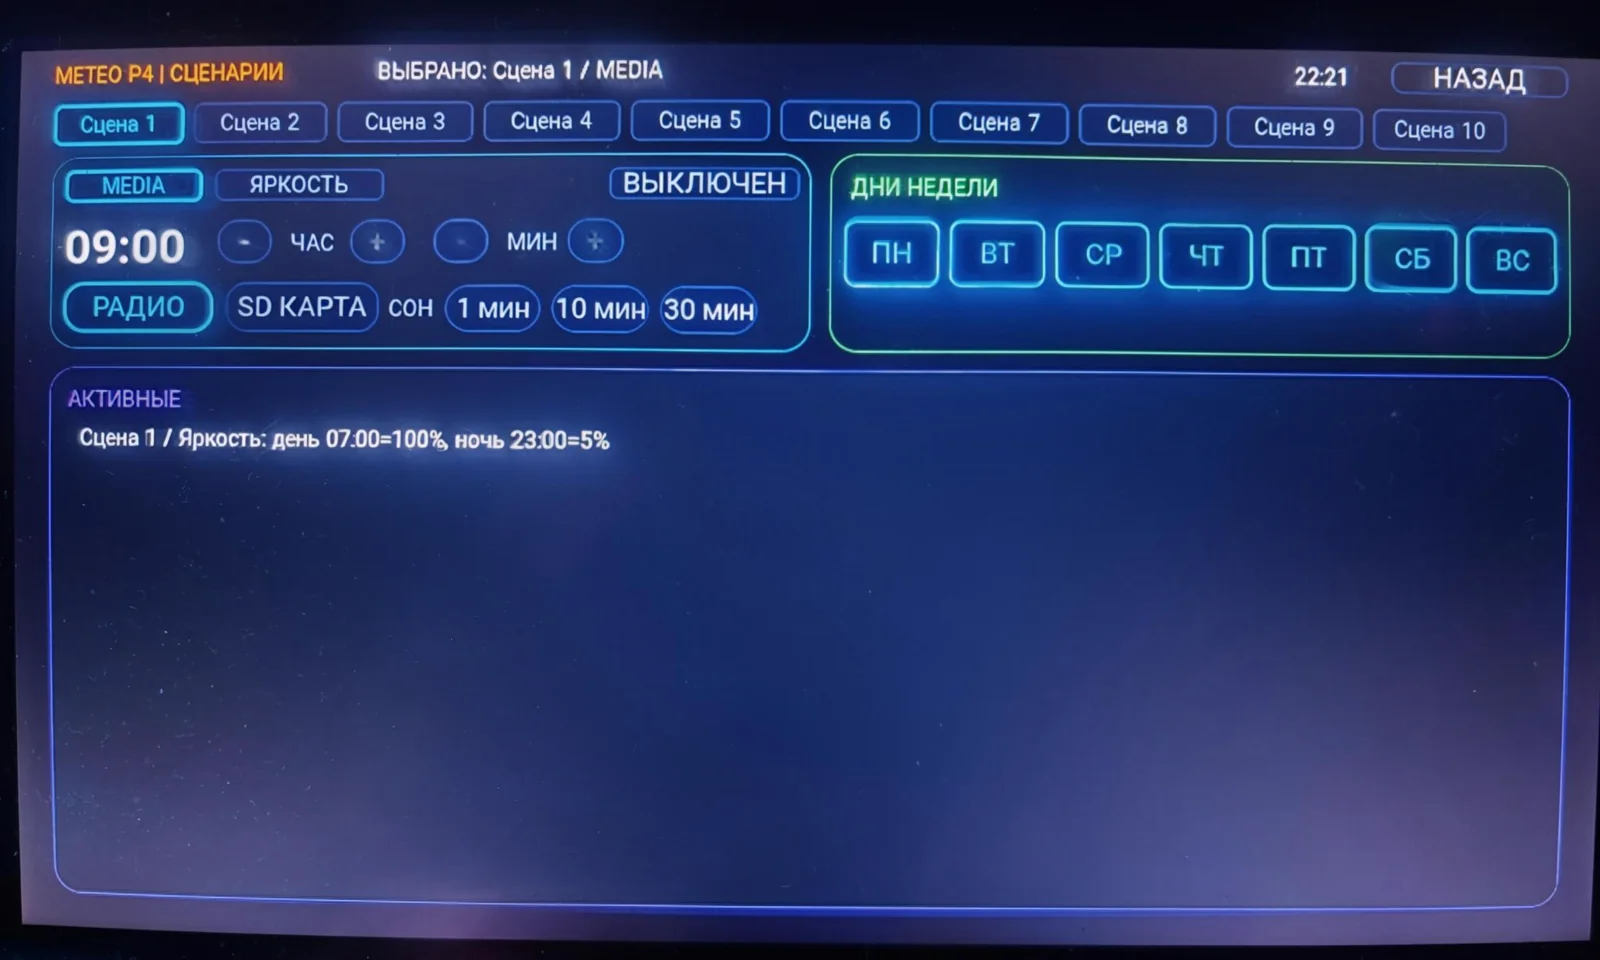
Screen structure
- Scenario tabs below the header:
Scene 1…Scene 4(MAX_SCENARIOS=4). - Left editor card with two sub-tabs: MEDIA and BRIGHTNESS, plus an ON / OFF button on the right to activate the scenario.
- Right card WEEKDAYS: 7 toggle buttons
MOTUWETHFRSASU. - Bottom wide card ACTIVE — list of active scenarios (or the text "No active").
MEDIA panel
- Large time display,
-/+buttons labelledHOURandMIN - Audio source buttons: RADIO / SD CARD
- SLEEP label and three sleep-timer buttons:
1 min,10 min,30 min
BRIGHTNESS panel
- DAY profile (yellow): start time + brightness percentage (default 100%)
- NIGHT profile (blue): start time + brightness percentage (default 25%)
Control Center (Settings)
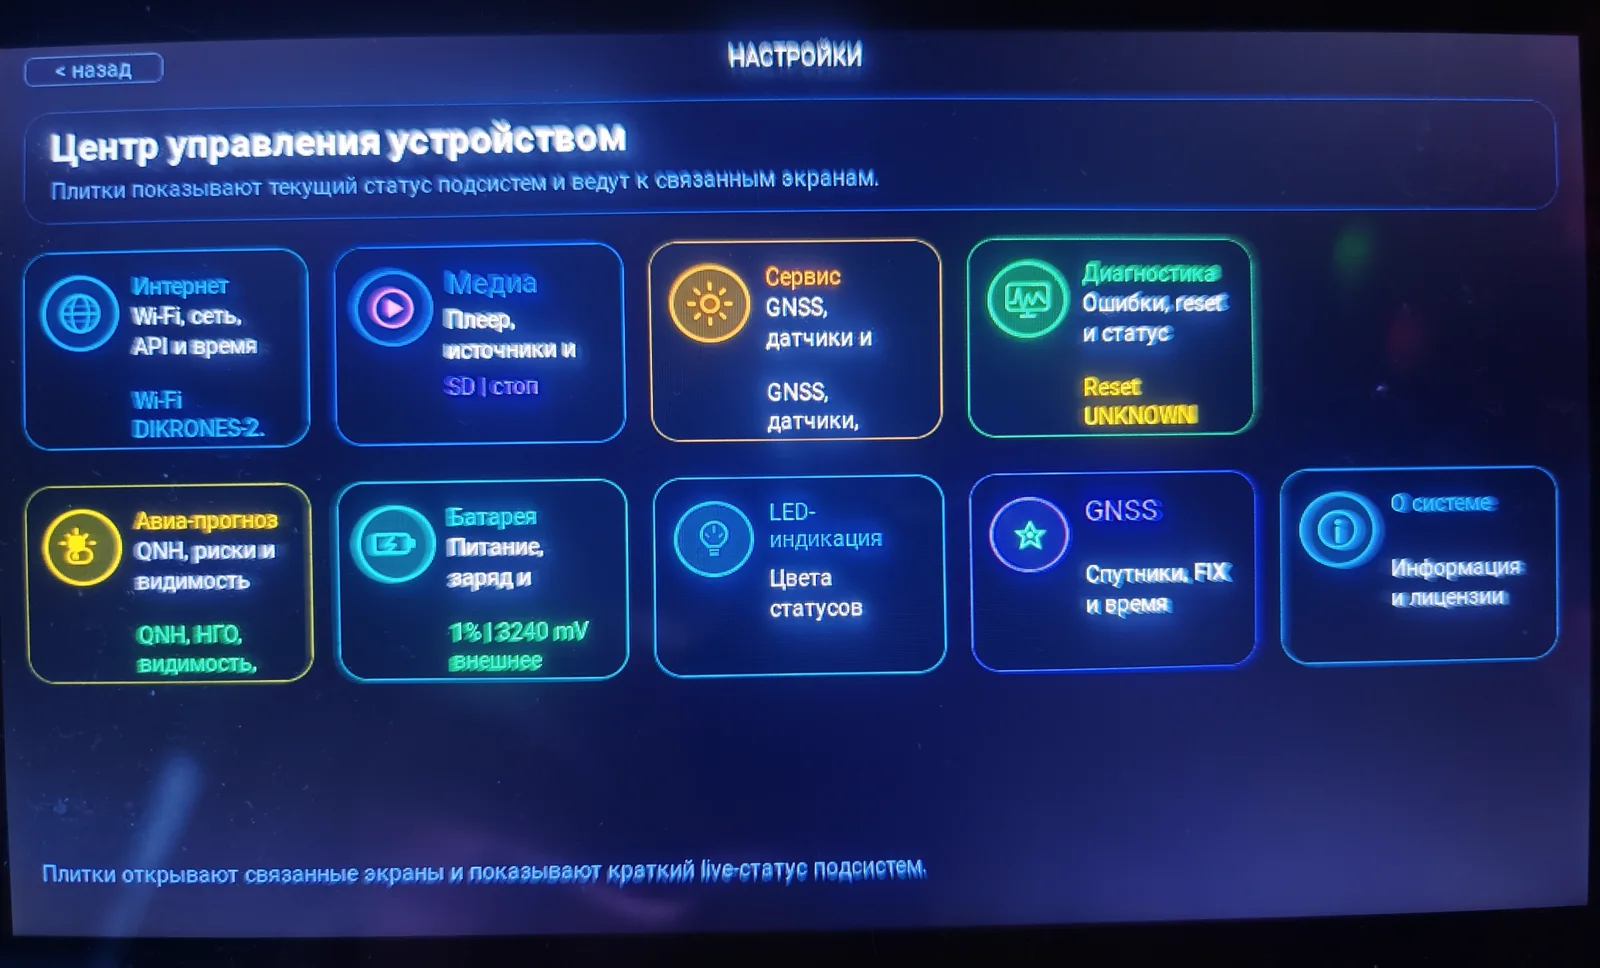
Access: the ⚙ chip in the Main screen header, or swipe left from any settings sub-screen. Topbar: SETTINGS.
Hero block: heading "Device Control Center"
Hint: "Tiles show the current status of subsystems and lead to related screens."
First-row tiles (5 items)
| Tile | Colour | Caption | Opens |
|---|---|---|---|
| Internet | Cyan | "Wi-Fi, network, API and time" | Wi-Fi screen |
| Media | Blue | "Player, sources and playback" | Player |
| Service | Orange | "GNSS, sensors and buses" | Service screen |
| Diagnostics | Green | "Errors, reset and status" | Diagnostics screen |
| Server | Cyan (0x26C6DA) | "MQTT telemetry" | MQTT screen |
Second-row tiles (5 items)
| Tile | Colour | Caption | Opens |
|---|---|---|---|
| Local Forecast | Yellow | "Weather, risks and visibility" | Local Forecast |
| Battery | Turquoise (0x2FE6C8) | "Power, charge and status" | — (status only) |
| LED Indicators | Cyan | "Status colours" | LED Indicators |
| GNSS | Purple | "Satellites, FIX and time" | GNSS screen |
| About | Light blue (0x8BC8FF) | "Information and licenses" | About |
Wi-Fi / Internet
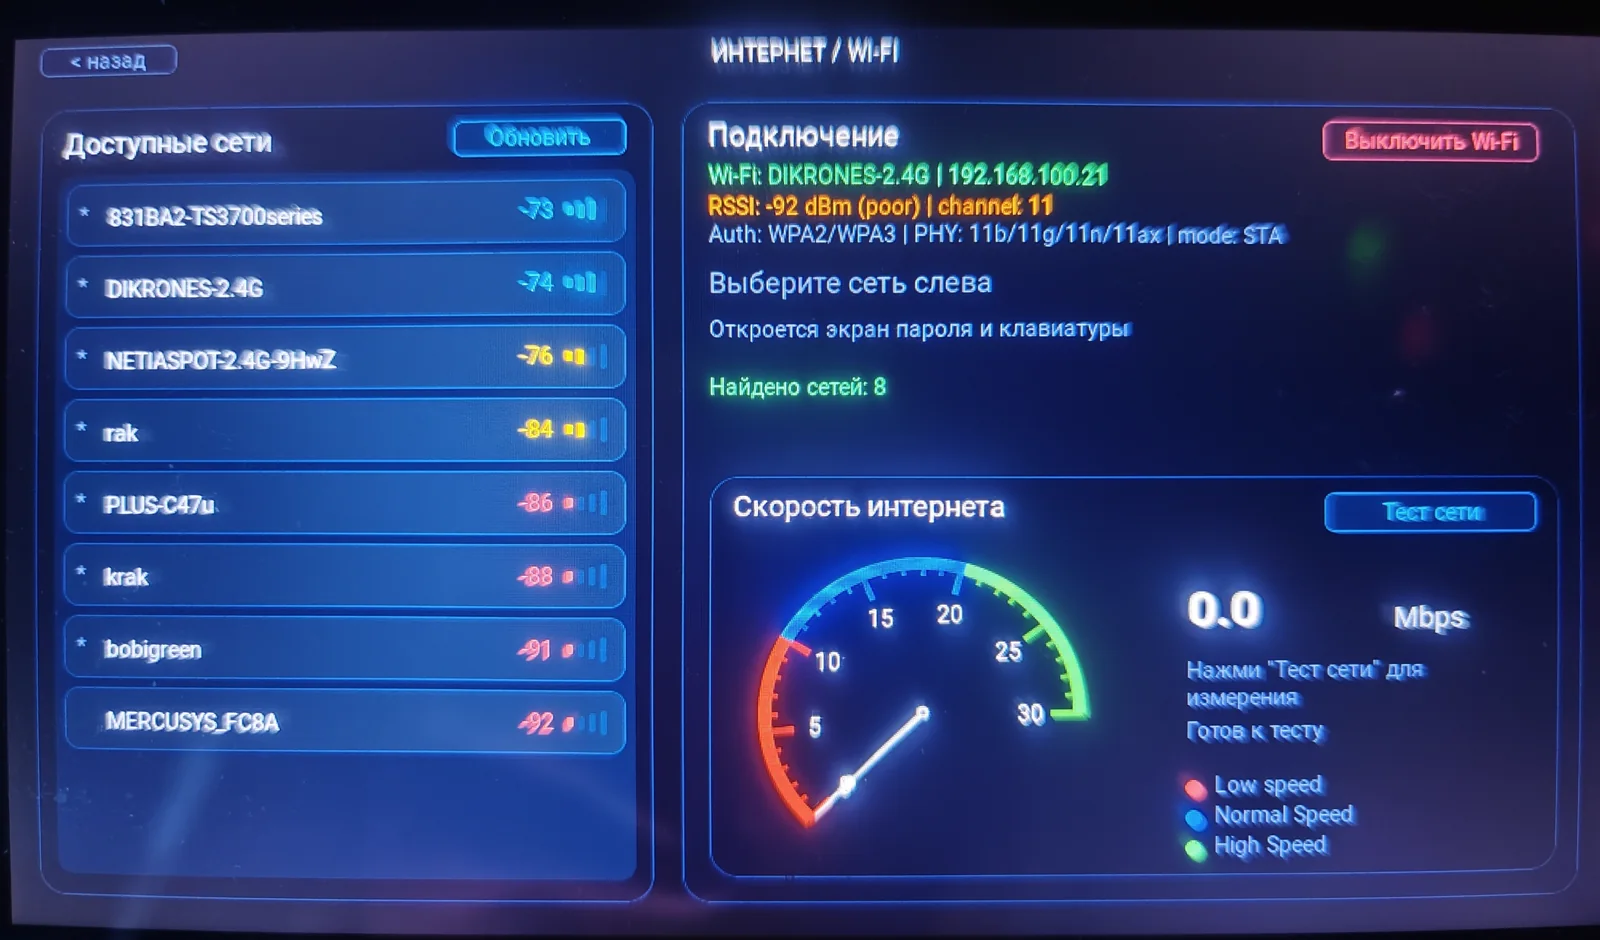
Access: the Wi-Fi chip in the Main screen header, or the "Internet" tile in Settings. Screen header: INTERNET / WI-FI. On the left — the BACK button.
Left card — "Available networks"
- Card heading: Available networks
- List of SSIDs sorted by signal (number of rows is set by
WIFI_UI_SCAN_ROWS) - Each row:
*— protected network, SSID (DOT truncation), RSSI (dBm), 4-segment signal bar - RSSI colour thresholds (4 levels): ≥ -65 dBm (green), ≥ -75 (cyan), ≥ -85 (yellow), < -85 (red)
- "Refresh" button in the upper-right corner — repeat scan
Right card — "Connection"
- Card heading: Connection
- Line 1:
Wi-Fi: SSID | IP addressorWi-Fi: off - Line 2:
RSSI: dBm (rating) | channel: N - Line 3:
Auth: -- | PHY: -- | mode: STA - Two-line hint: "Select a network on the left" + "The password keyboard screen will open"
- Status line:
Ready to scan/Scanning… - "Turn off Wi-Fi" / "Turn on Wi-Fi" button (upper-right corner of the card; changes colour and text by state)
"Internet speed" card
Embedded in the right panel: heading Internet speed, "Network test" button in the top corner, and an arrow-style speedometer (LV scale, range 0–30 Mbps, 225° angle) with three colour zones:
| Zone | Colour | Speed |
|---|---|---|
| Low speed | Red | 0–10 Mbps |
| Normal speed | Blue | 10–20 Mbps |
| High speed | Green | 20+ Mbps |
The "Network test" button starts the measurement. The result is shown as a digit (Mbps) and the arrow position.
Connecting to a network
- Tap the desired network in the list on the left
- The password entry screen opens with an on-screen keyboard
- Enter the password (lower/upper case, digits and special characters available)
- Press OK — the device will try to connect
- Connection status is shown in the right panel
Service Screen
Access: Settings → "Service" tile.
Caption at the bottom of the screen: "The screen updates automatically. Live and static hardware data of the board."
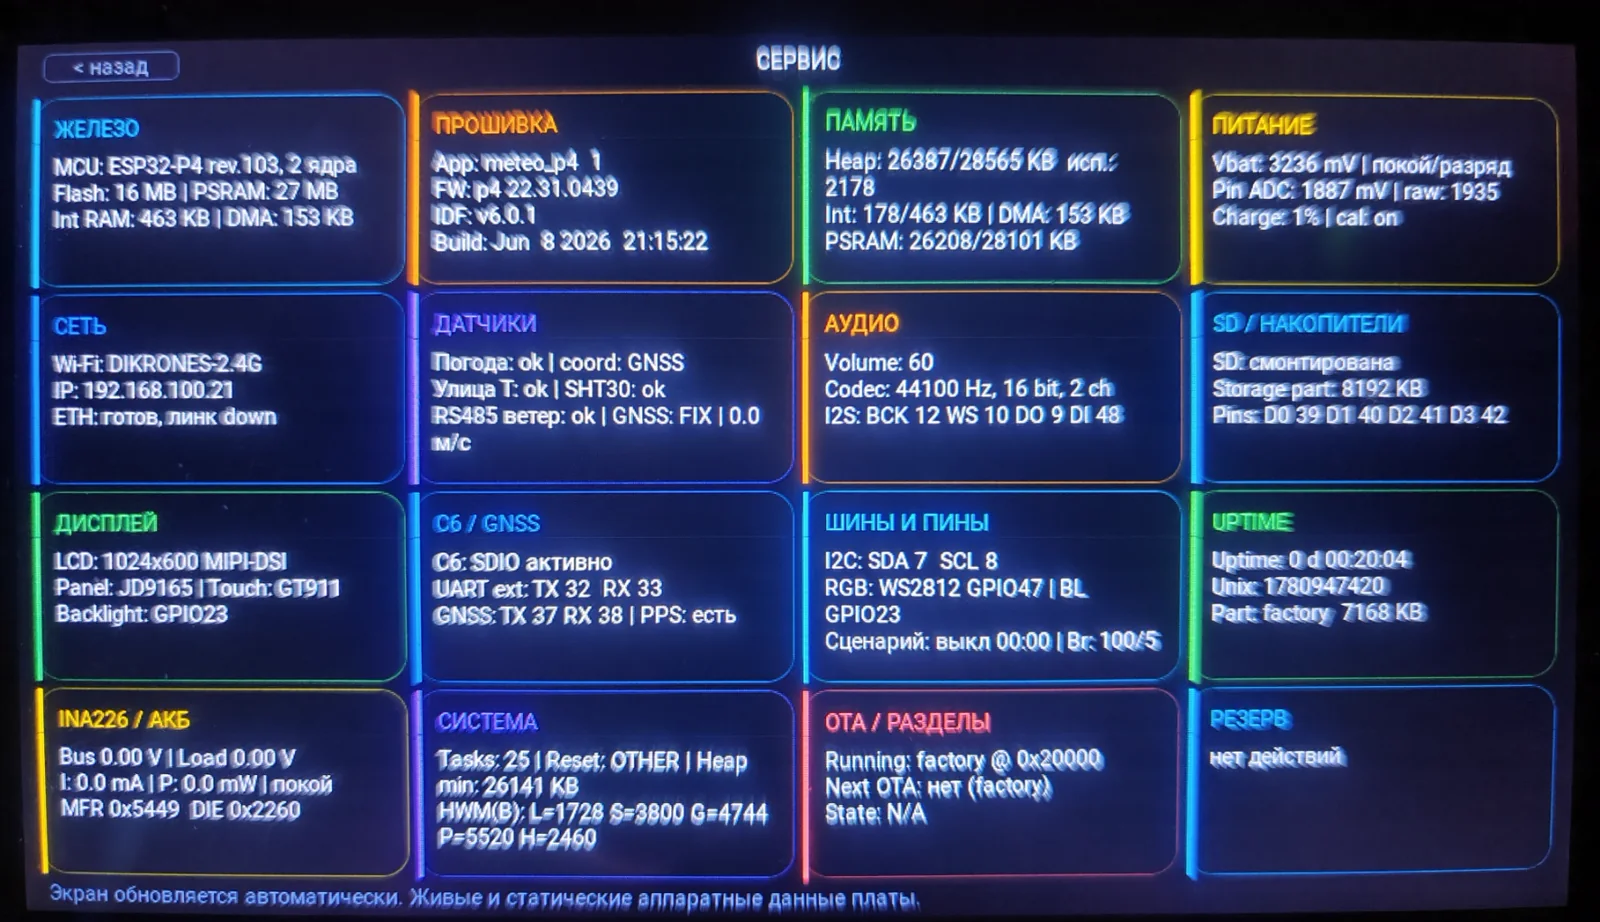
The screen consists of 16 tiles arranged in four rows of four. Each tile has a coloured border.
Row 1
| Tile | Content |
|---|---|
| HARDWARE | MCU: ESP32-P4 rev.X, N cores Flash: 16 MB | PSRAM: 27 MB Int RAM: XXX KB | DMA: XXX KB |
| FIRMWARE | App: meteo_p4 N FW: p4 22.31.XXXX IDF: v6.0.1 Build: date and time of compilation |
| MEMORY | Heap: free/total KB, used Int: free/total KB | DMA: XXX KB PSRAM: free/total KB |
| POWER | Vbat: XXX mV | status (rest/charge/discharge) Pin ADC: XXX mV | raw: XXXX Charge: X% | cal: on/off |
Row 2
| Tile | Content |
|---|---|
| NETWORK | Wi-Fi: SSID IP: X.X.X.X ETH: status (ready, link down / active) |
| SENSORS | Weather: ok/err | coord: GNSS/none Outdoor T: ok/err | SHT30: ok/err RS485 wind: ok/err | GNSS: FIX/NO FIX | X.X m/s |
| AUDIO | Volume: XX Codec: 44100 Hz, 16 bit, 2 ch. I2S: BCK GPIO | WS GPIO | DO GPIO | DI GPIO |
| SD / STORAGE | SD: mounted / not found Storage part: XXXX KB Pins: D0–D3 with GPIO numbers |
Row 3
| Tile | Content |
|---|---|
| DISPLAY | LCD: 1024×600 MIPI-DSI Panel: JD9165 | Touch: GT911 Backlight: GPIOXX |
| C6 / GNSS | C6: SDIO active UART ext: TX XX RX XX GNSS: TX XX RX XX | PPS: yes/no |
| BUSES AND PINS | I2C: SDA X SCL X RGB: WS2812 GPIOXX | BL GPIOXX Scenario: on/off | Brightness: XXX/X |
| UPTIME | Uptime: N d HH:MM:SS Unix: XXXXXXXXXX Part: factory | XXXX KB |
Row 4
| Tile | Content |
|---|---|
| INA226 / BATTERY | Bus V | Load V I: X.X mA | P: X.X mW | status MFR: 0xXXXX DIE: 0xXXXX |
| SYSTEM | Tasks: N | Reset: reason | Heap min: XXXX KB HWM(B): L=XXXX S=XXXX G=XXXX P=XXXX H=XXXX |
| OTA / PARTITIONS | Running: factory @ 0xXXXXX Next OTA: none (factory) / ota_0 State: N/A / Valid / Invalid |
| TIME / NTP | Current system time, sync source, NTP status |
Diagnostics
Access: Settings → "Diagnostics" tile. Topbar: DIAGNOSTICS.
The screen consists of 8 tiles (2 columns × 4 rows) with live data and hints:
| Tile | Colour |
|---|---|
| LAST RESET REASON | Red |
| MEMORY / FREERTOS | Green |
| POWER / BATTERY | Yellow |
| NETWORK | Blue |
| SENSORS / GNSS | Purple |
| OTA / PARTITIONS | Cyan |
| ERRORS / REASONS | Orange |
| WHAT TO CHECK | Orange |
Footer hint: "Diagnostics shows the reset cause, live state of the network, sensors and power. For PANIC/WDT keep the UART log: the UI sees the final cause, but not the full backtrace."
About
Access: Settings → "About" tile. A scrollable text report with the following sections:
- IDENTIFICATION AND BUILD — ESP32-P4 chip rev, cores, Flash 16 MB, PSRAM, heap summary.
- NETWORK AND STORAGE — Wi-Fi online/offline + SSID, Ethernet, SD, factory partition (with address and size), storage partition.
- POWER AND STATE — Vbat, detect, raw ADC, percentage, charge status ("charging" / "rest/discharge" / "--"), uptime as
N d HH:MM:SS, Unix time, reset cause. - SENSORS AND SERVICES — Weather ok/none, GNSS time, Outdoor T, Pressure, CO2/VOC/NOx, Audio volume, OTA status.
- COPYRIGHT HOLDER AND TERMS OF USE — Sergii Stelmakhovych / SRG BlackCore, firmware license version 2.0, proprietary license text.
- THIRD-PARTY LICENSES — list and links to license texts: LVGL (MIT), ESP-IDF / BSP / esp_hosted / esp-audio-player / esp-libhelix-mp3 (Apache-2.0).
- Full text of the proprietary license (from the embedded
LICENSE_PROPRIETARY.txt).
LED Indicators
Access: Settings → "LED Indicators" tile.
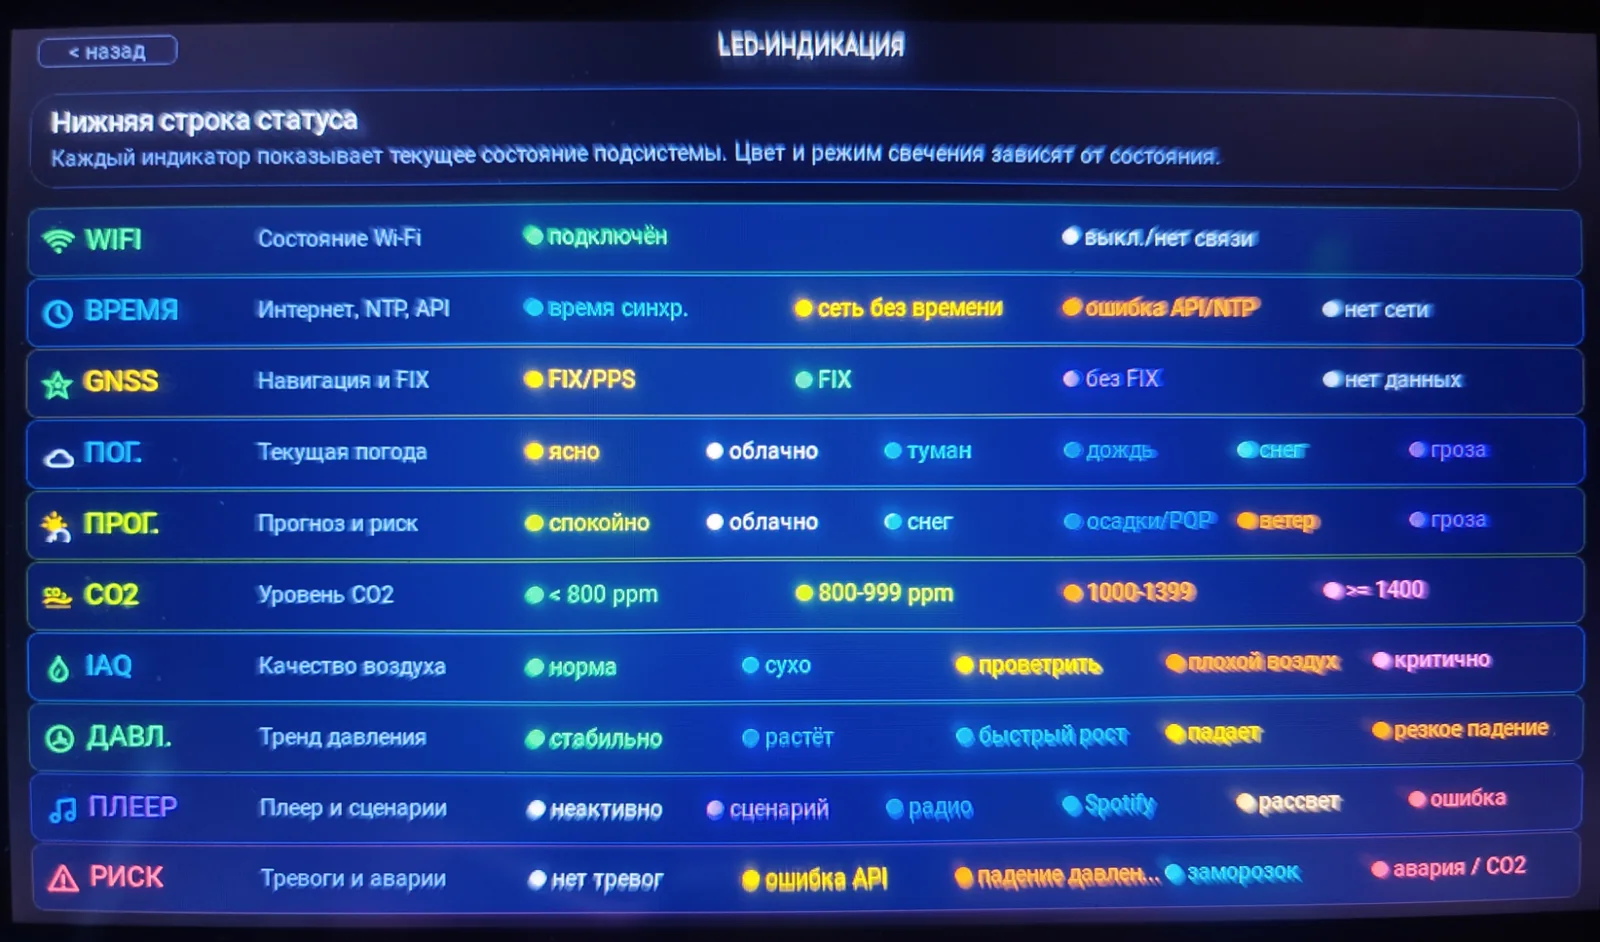
Topbar: LED INDICATORS. Intro card: "Bottom status bar" / "Each indicator shows the current state of a subsystem. Colour and lighting mode depend on the state."
The screen describes the bottom status bar of the Main screen — 10 indicators, each showing the state of one subsystem.
| Indicator | Subsystem | States (left — better, right — worse) | ||||
|---|---|---|---|---|---|---|
| WIFI | Wi-Fi state | ● connected | ● off / no link | |||
| TIME | Internet, NTP, API | ● time synced | ● network without time | ● API/NTP error | ● no network | |
| GNSS | Navigation and FIX | ● FIX/PPS | ● FIX | ● no FIX | ● no data | |
| WEATH. | Current weather | ● clear | ● cloudy | ● fog | ● rain | ● snow ● thunderstorm |
| FORE. | Forecast and risk | ● calm | ● cloudy | ● snow | ● precipitation/POP | ● wind ● thunderstorm |
| CO2 | CO₂ level | ● < 800 ppm | ● 800–999 ppm | ● 1000–1399 | ● ≥ 1400 | |
| IAQ | Air quality | ● normal | ● dry | ● ventilate | ● bad air | ● critical |
| PRESS. | Pressure trend | ● stable | ● rising | ● rapid rise | ● falling | ● sharp drop |
| PLAYER | Player and scenarios | ● inactive | ● scenario | ● radio ● Spotify | ● dawn | ● error |
| RISK | Alarms and faults | ● no alarms | ● API error | ● pressure drop | ● frost | ● fault / CO₂ |
Automatic Alerts and Thresholds
| Alert / indicator | Condition in code |
|---|---|
| High CO₂ (LED CO2) | Colour zones: < 800 / 800-999 / 1000-1399 / ≥ 1400 ppm (see LED Indicators). Signal threshold in meteo_data: AIR_CRITICAL ≥ 1500 ppm. |
| "Ventilate now" card | CO₂ ≥ 1400 ppm with hysteresis down to 1350 (see Sensors screen, level 1). |
| Pressure drop | Δp ≥ −3 hPa over 3 hours (trend "Falling fast", RGB pressure zone). |
| Frost risk | In the synoptic code: SYN_FROST_TEMP_C = 2.0 °C — outdoor temperature is taken into account (RS485 SHT30); affects the RISK LED zone. |
MQTT Telemetry (Server)
Access: the Server tile in the Control Center. Swipe right returns to Settings. The mqtt_telemetry component publishes the firmware version (mqtt_telemetry_set_firmware_version) and live sensor readings to the MQTT broker.
Data Storage
| Storage | What is stored | Notes |
|---|---|---|
| NVS (Flash) | Wi-Fi settings, time zone, SGP41 calibration, audio settings | Survives reboot and power loss |
| LP-SRAM (RTC) | 48-point barograph, chart history, forecast history | Survives esp_restart() and WDT reset. Does NOT survive cold power-on |
| SPIFFS | Backups of charts and forecast history | Restored after cold start |
| SD card (FAT32) | CSV/JSON sensor log, audio files | Up to 4 simultaneous streams |
Firmware Version
The current firmware version is shown on the Service screen in the FIRMWARE tile.
Version format: p4 YY.NN.XXXX
p4— ESP32-P4 platformYY— year (22 = 2022)NN— iteration / build numberXXXX— source-code change counter
Meteo P4 · Firmware p4 22.31.0641 · ESP-IDF 6.0.1 · LVGL v9